
Using the Monitor dashboard
The Dashboard of the Monitor is the first port of entry when logging in for the first time.
Introduction
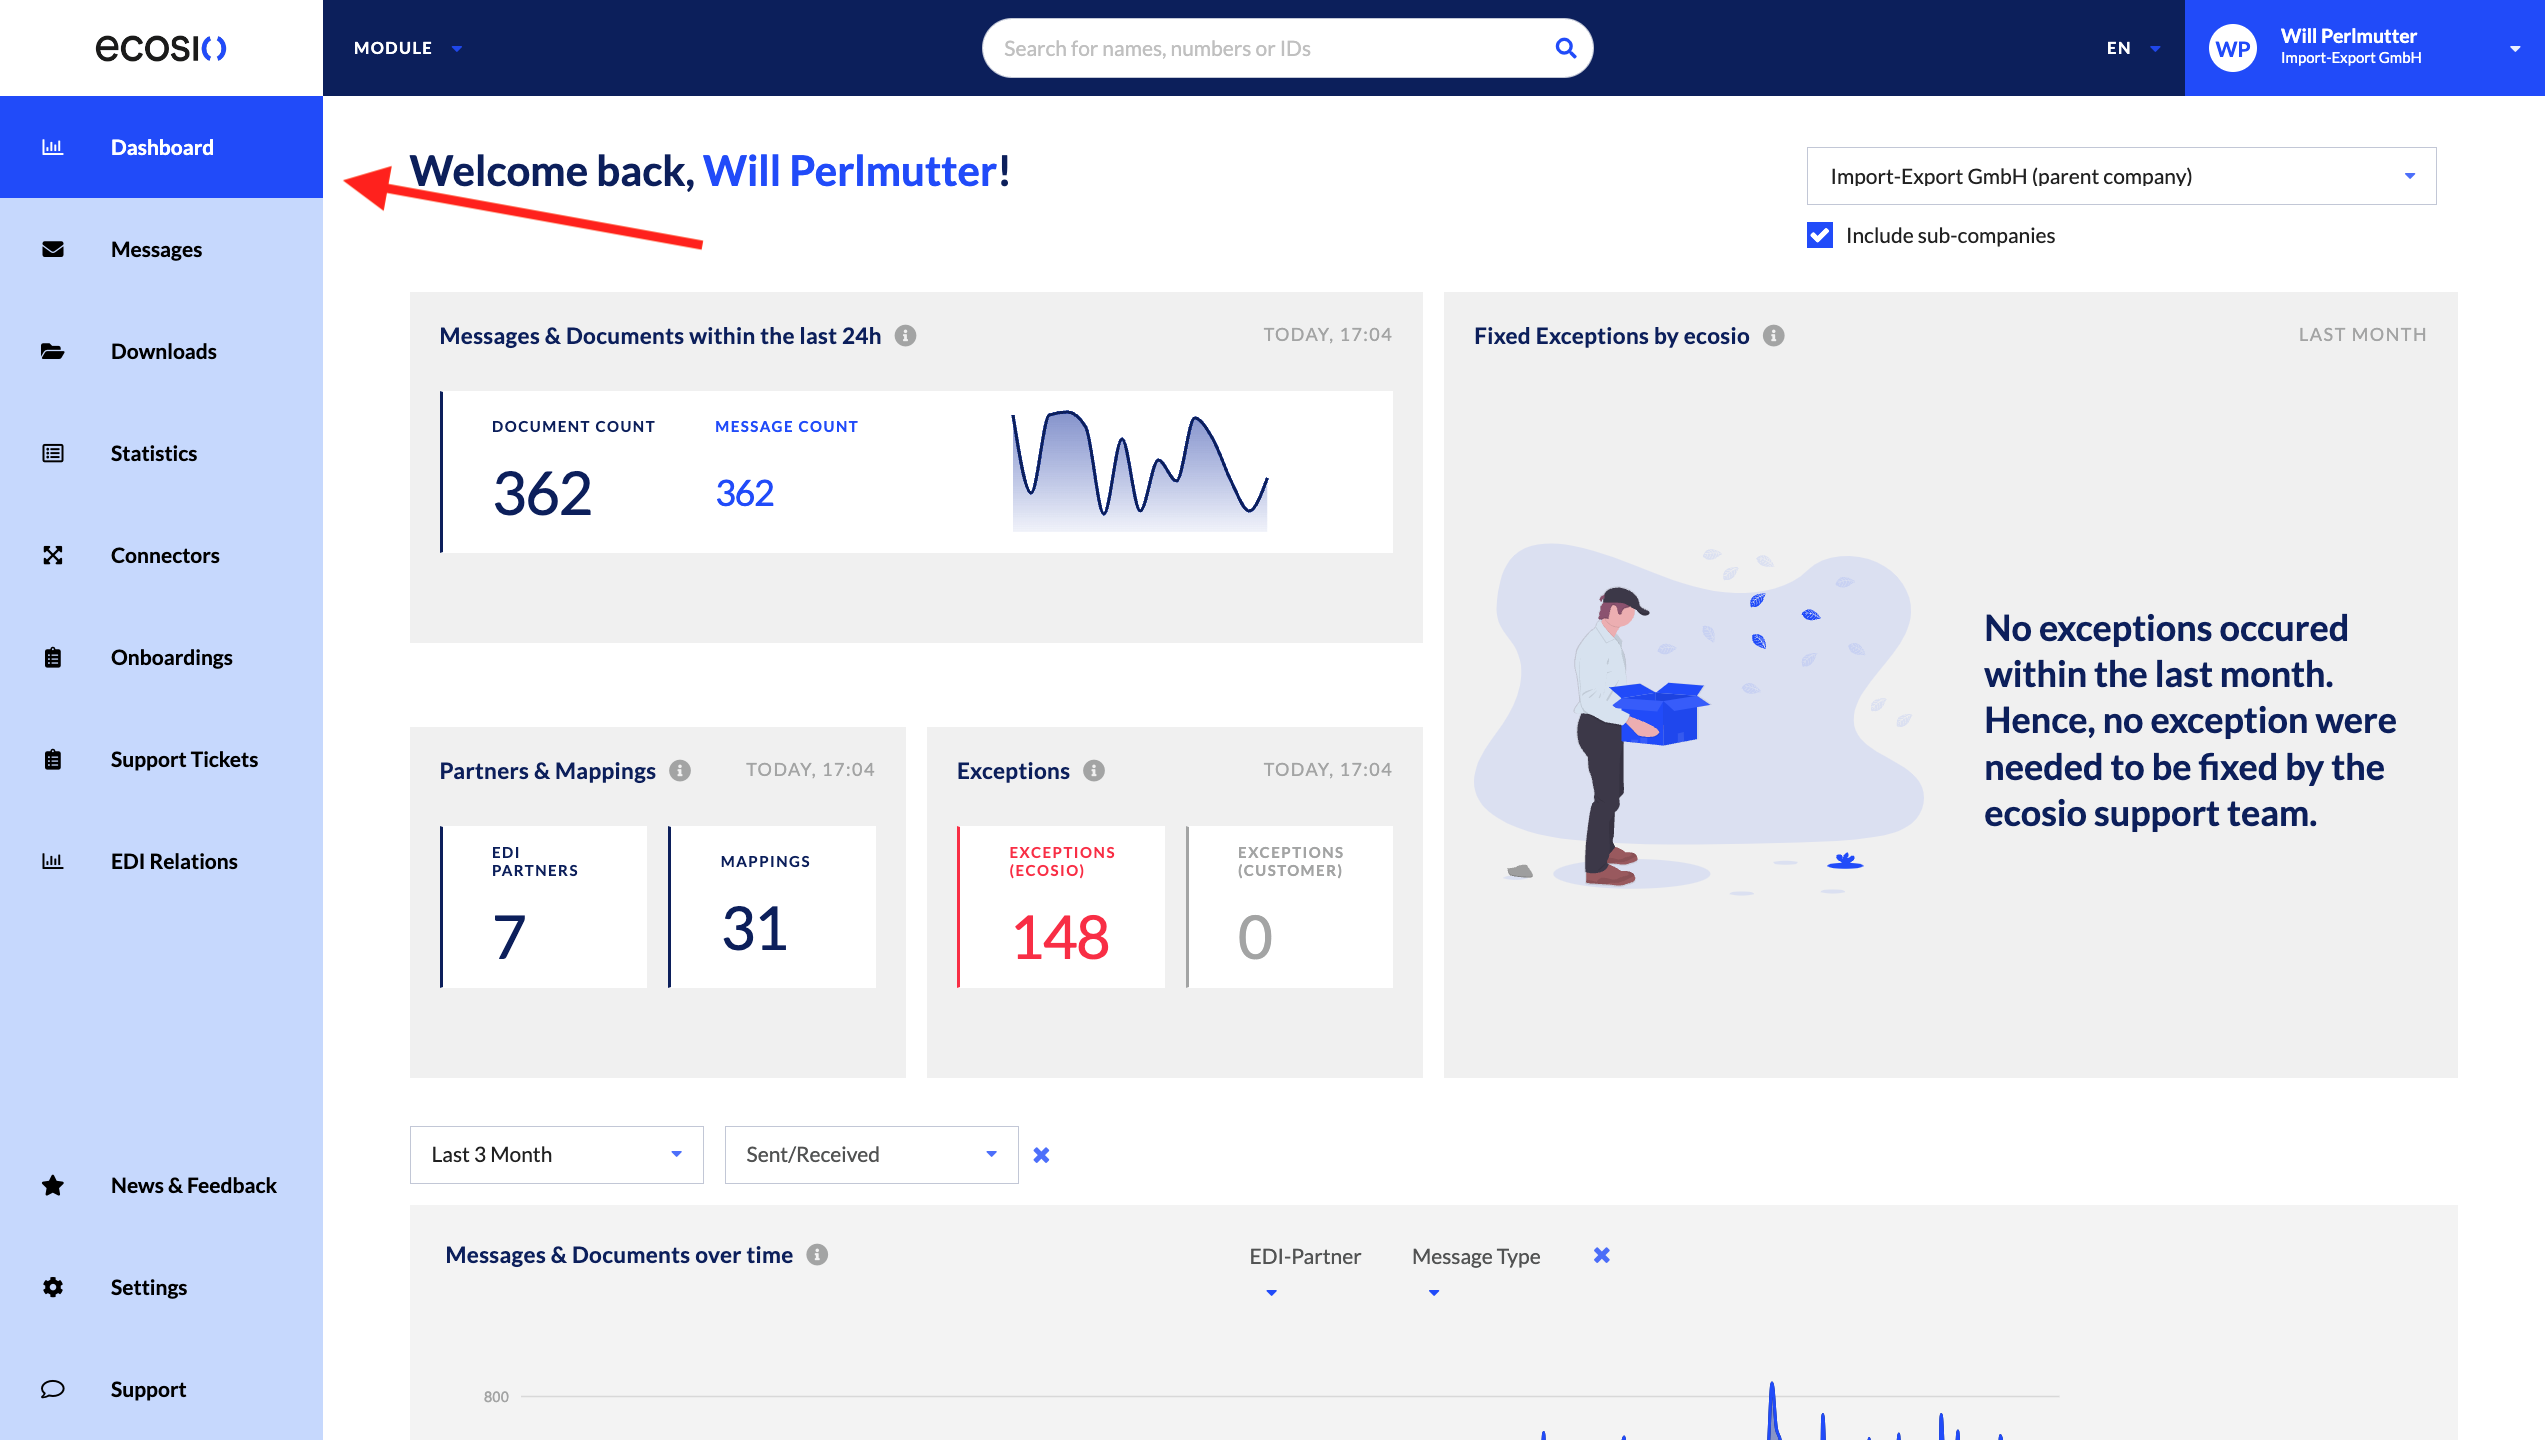
The Dashboard of the Monitor is the first port of entry when logging in for the first time. It looks as follows, with its menu entry shown in the top left-hand corner:
Prerequisites
A few things to keep in mind:
- As long as you and your colleague users have a Monitor instance set up by the Onboarding & Operations team, you will be able to view the Dashboard.
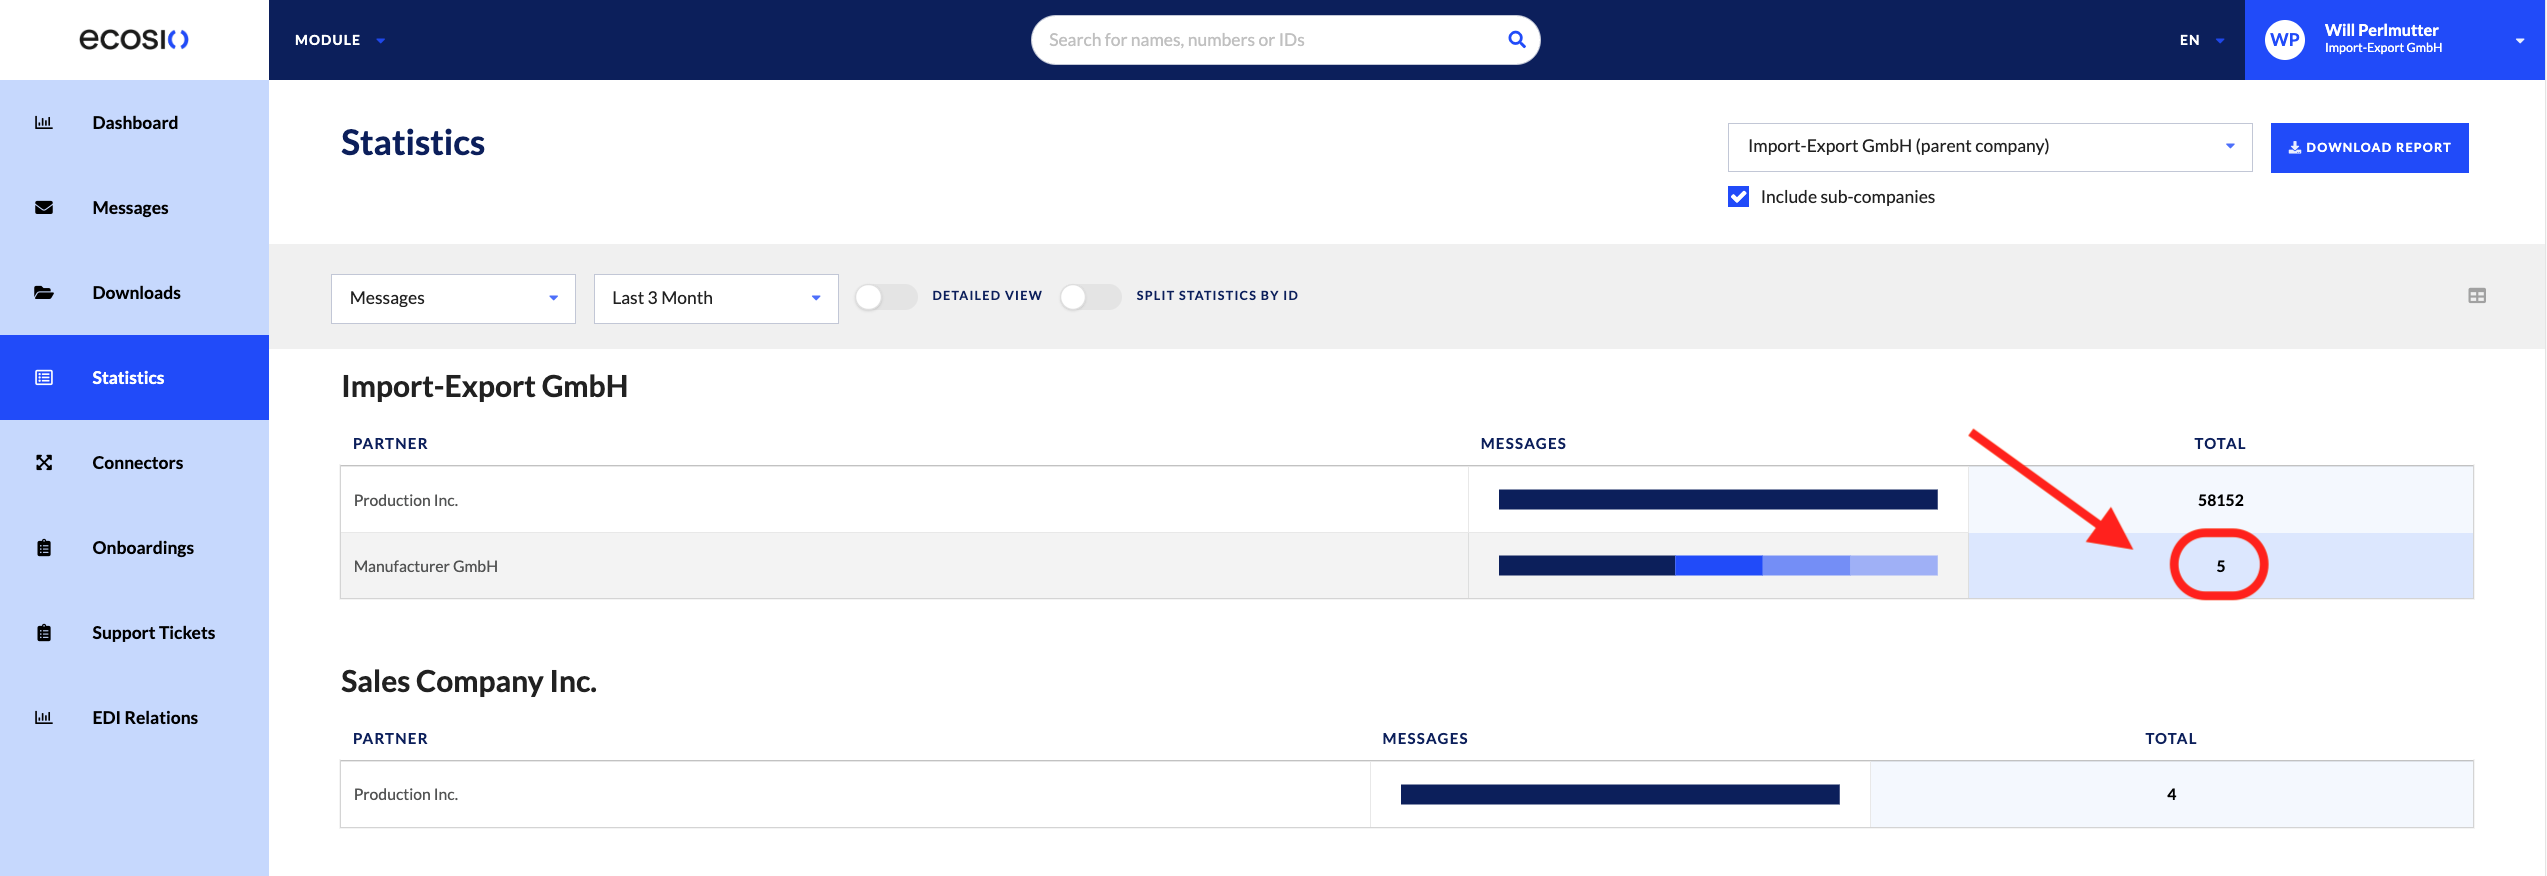
- The messaging statistics rendered in the Dashboard derive from the Message Overview page, and not the Statistics Details page. What is the difference? The Statistics Details page renders statistics based on messages billed (which have reached the ecosio integration hub and have been forwarded accordingly), whereas the Message Overview page renders all messages and documents, whether billed or not.
Step-by-step guide
What can you visualise and act on in the Dashboard?
Statistics by Parent and Sub-Company Structure
Users can see statistics based on the parent or sub-company, depending on which company you are a user of. It is show below:
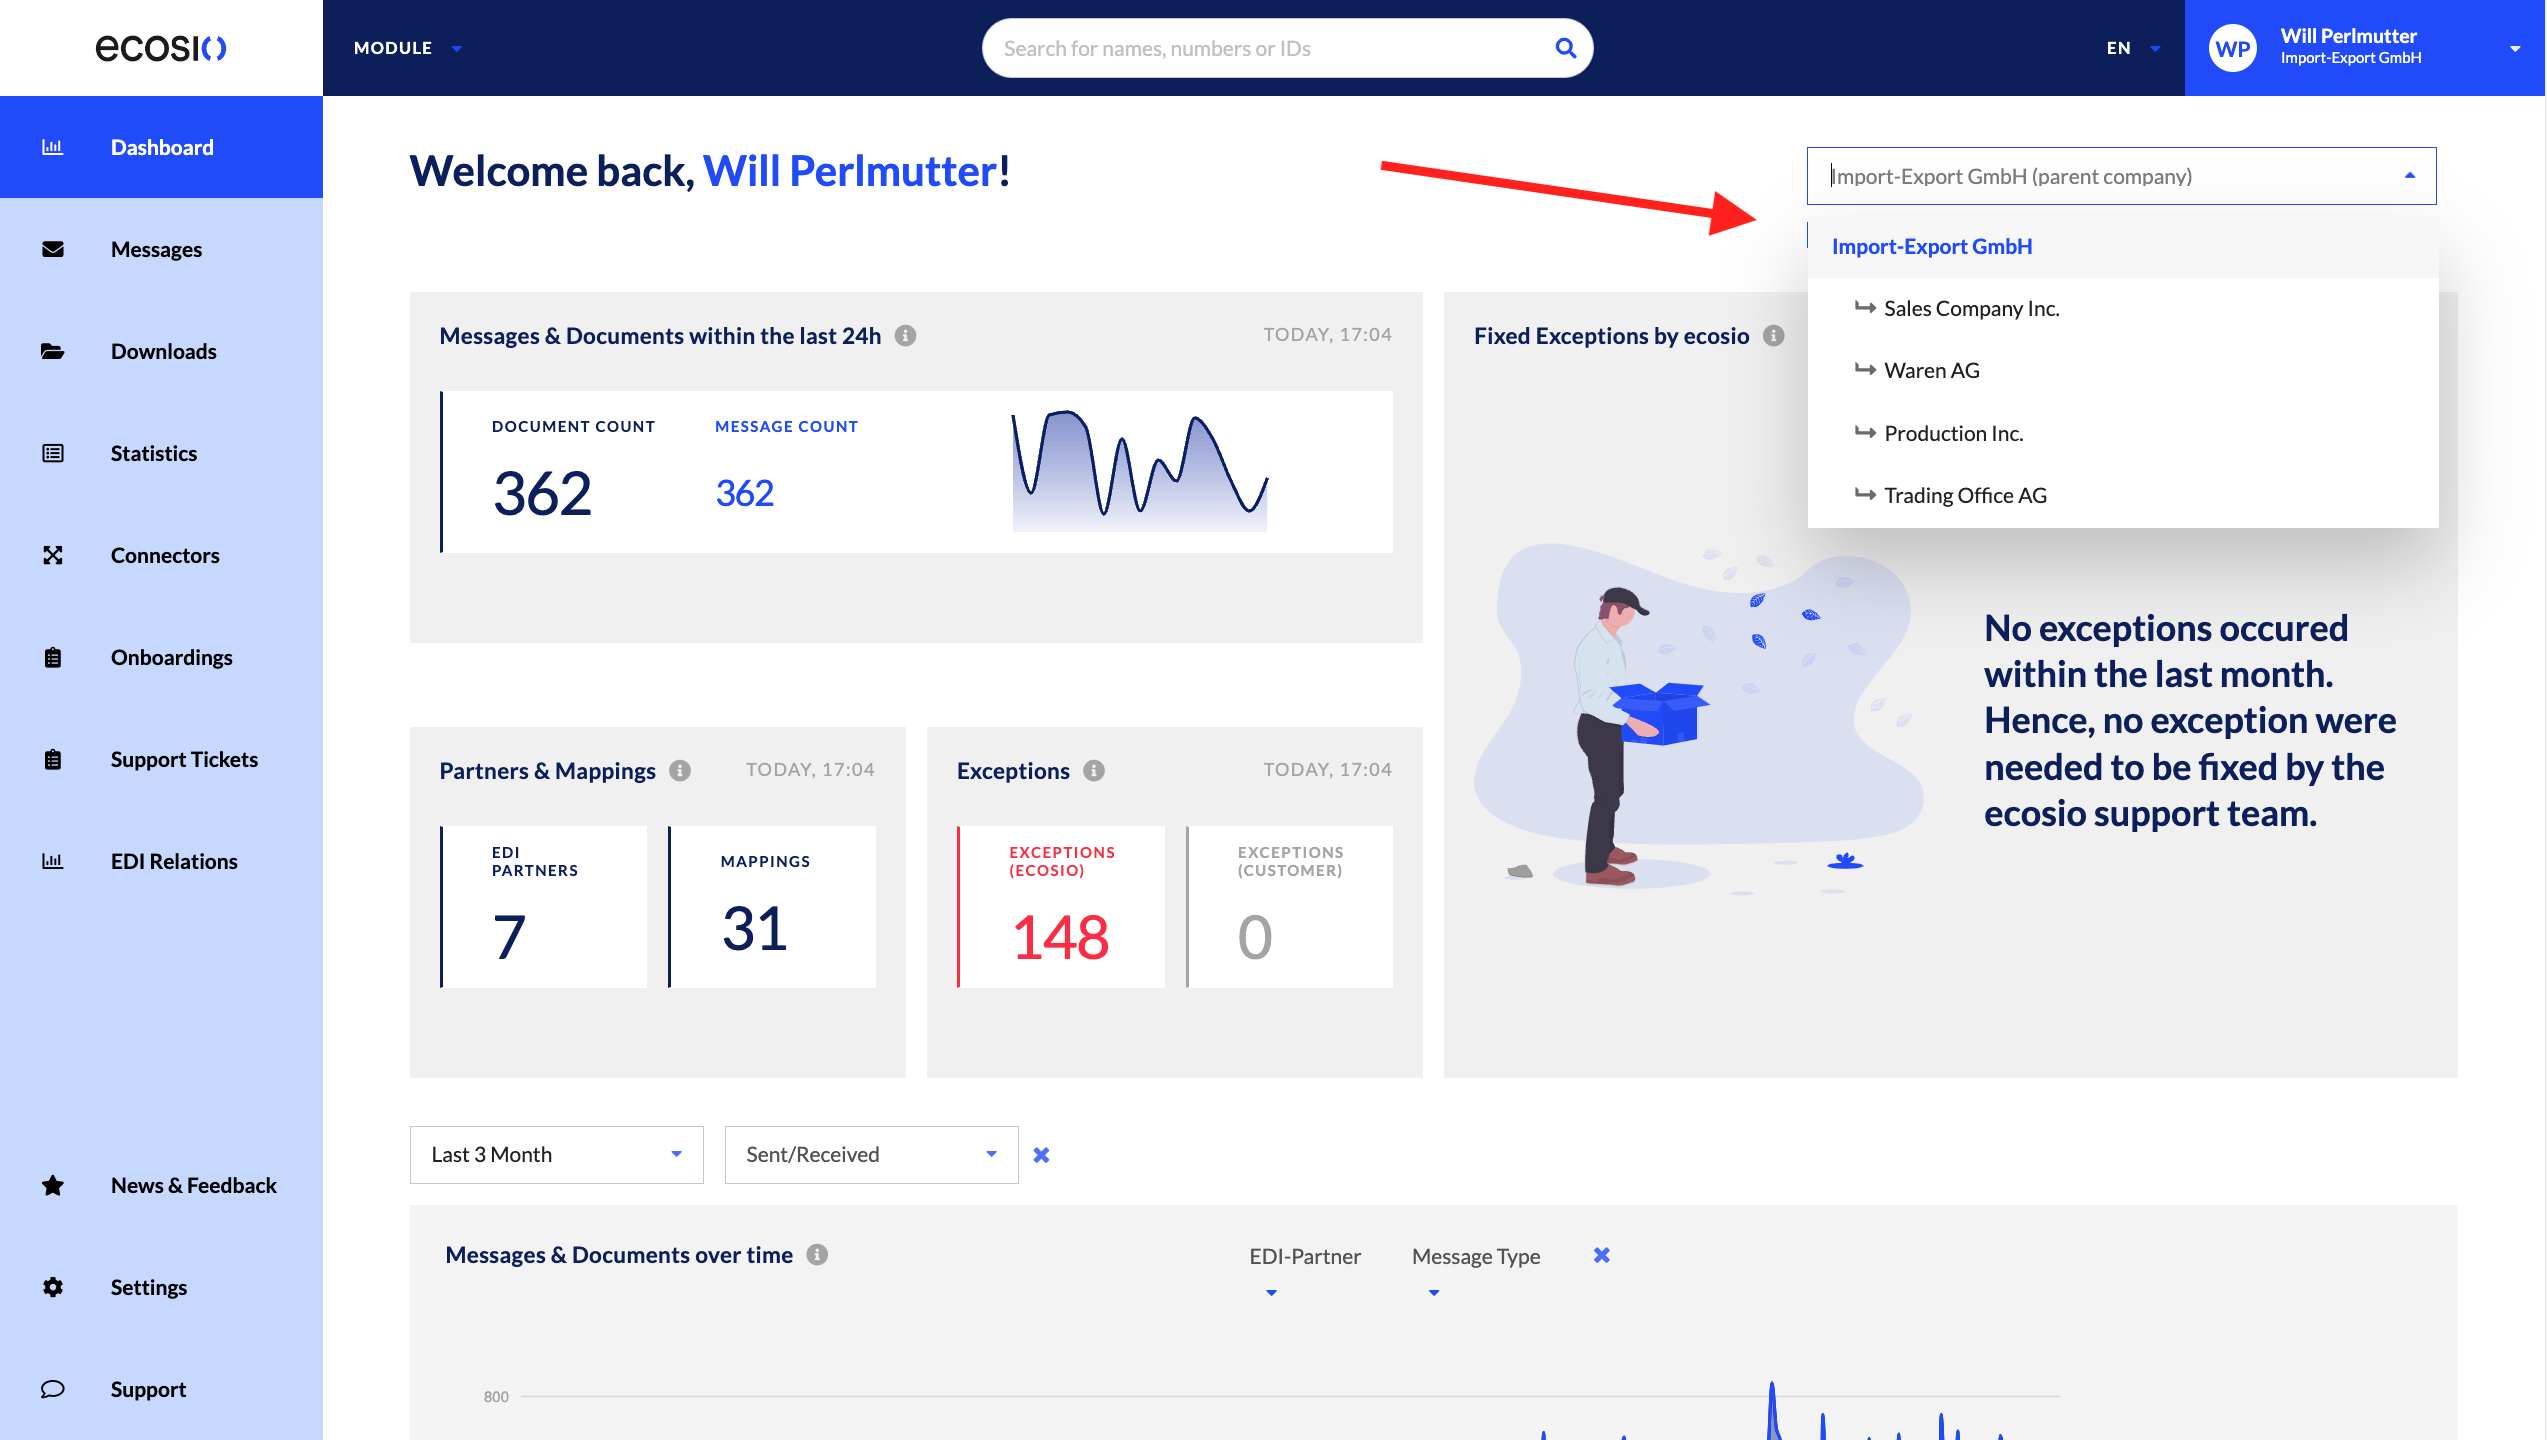
See the documentation on parent and sub-company structures for more information.
Messages and Documents within the last 24 hours
Users can know the entire document and message count during the last day (24 hours), as shown below:
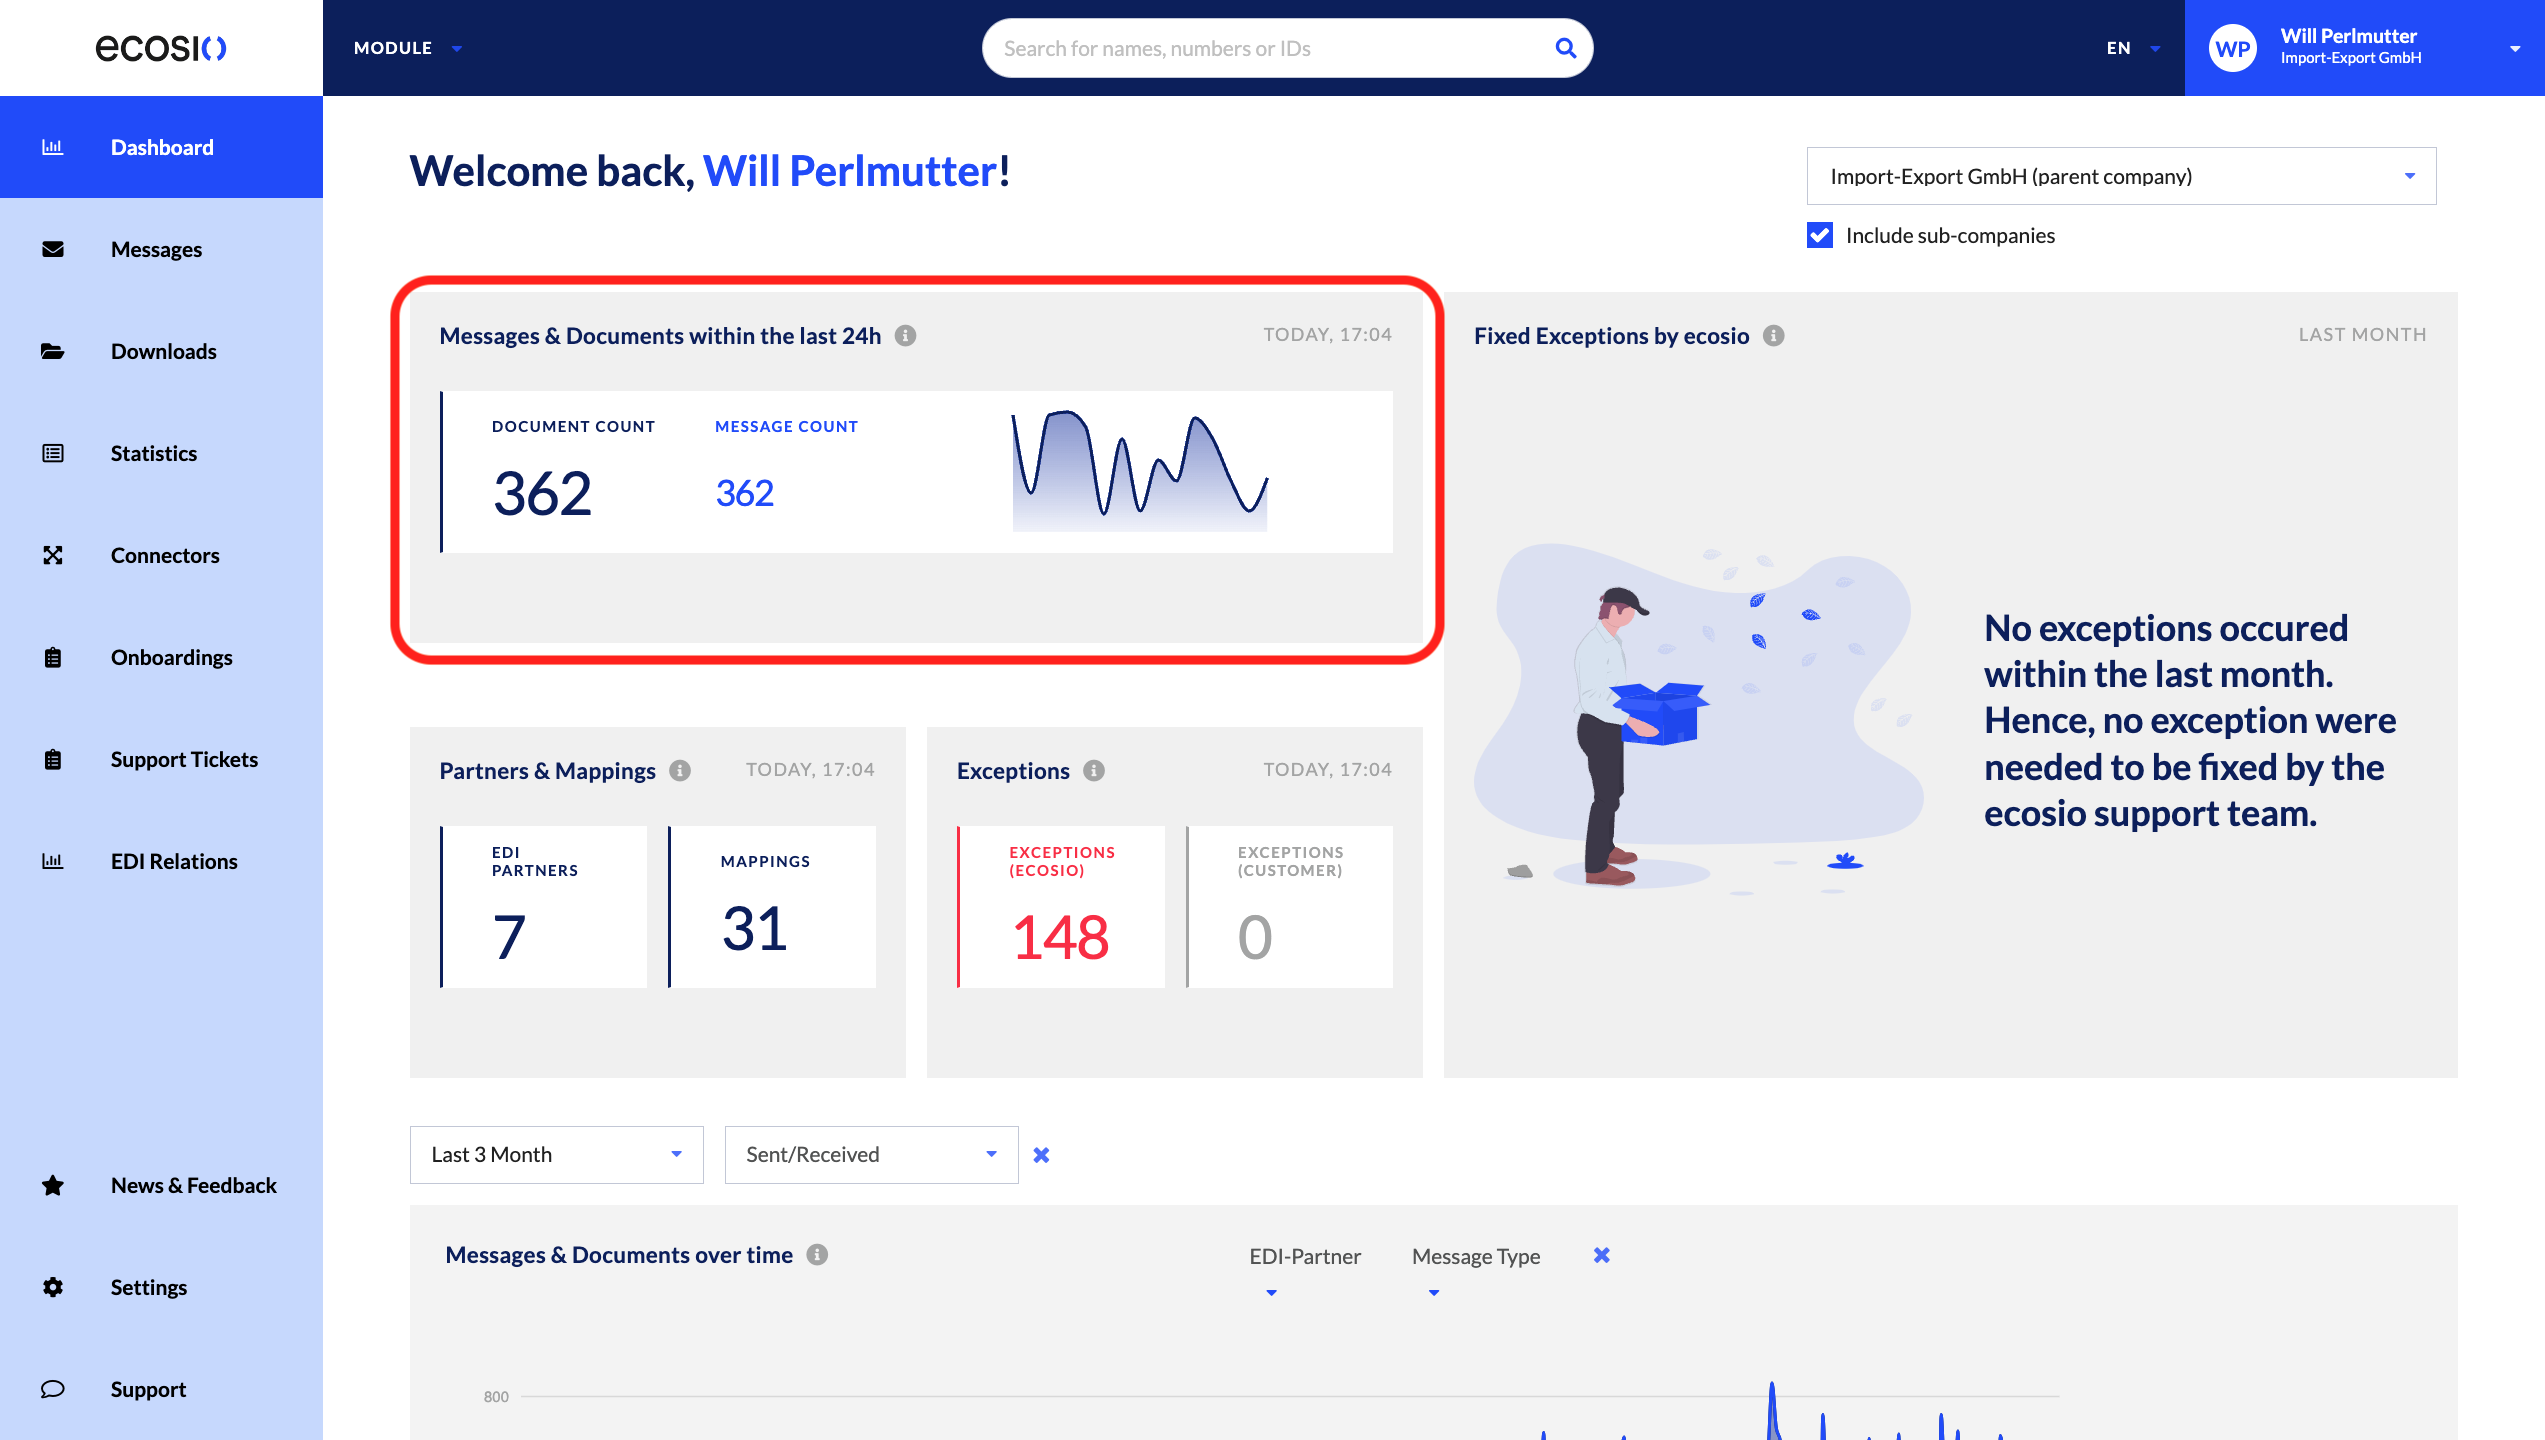
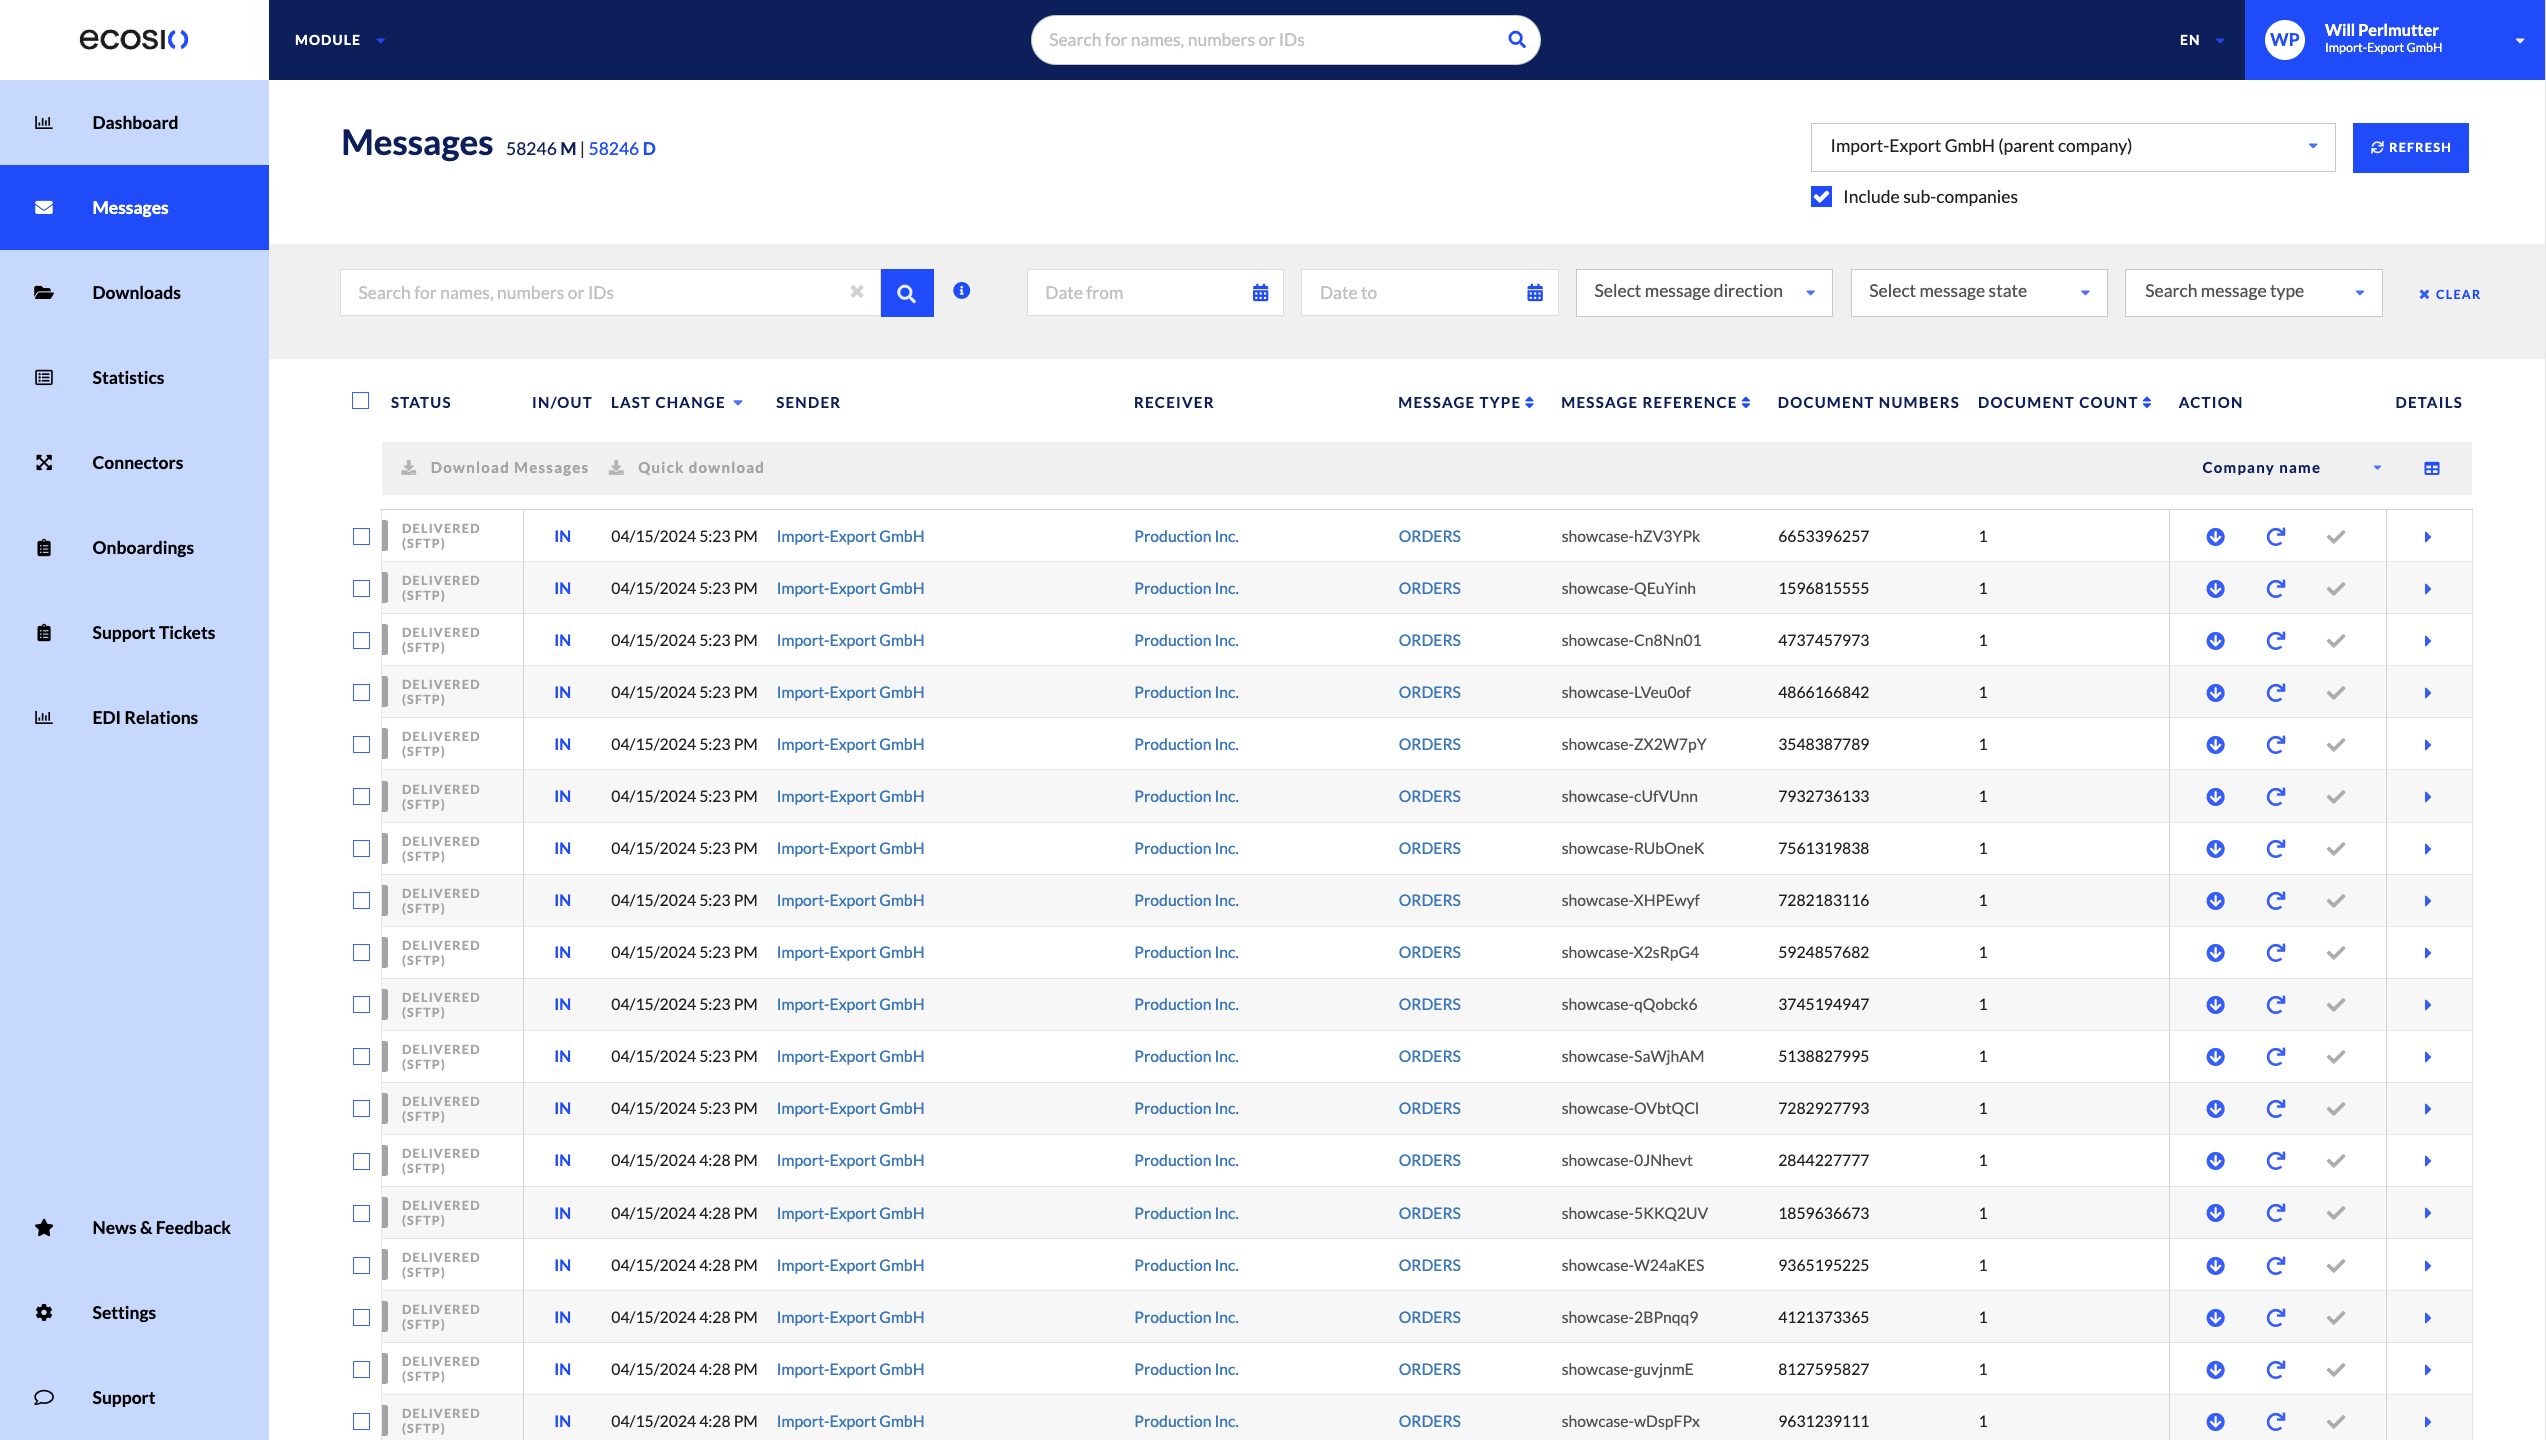
This section is also clickable. You will be taken to the Message Overview page and shown the latest messages.
Partners & Mappings
You can view all EDI Partners with whom your company currently exchanges messages and documents, as well as the total Mappings which have taken place to date, shown below:
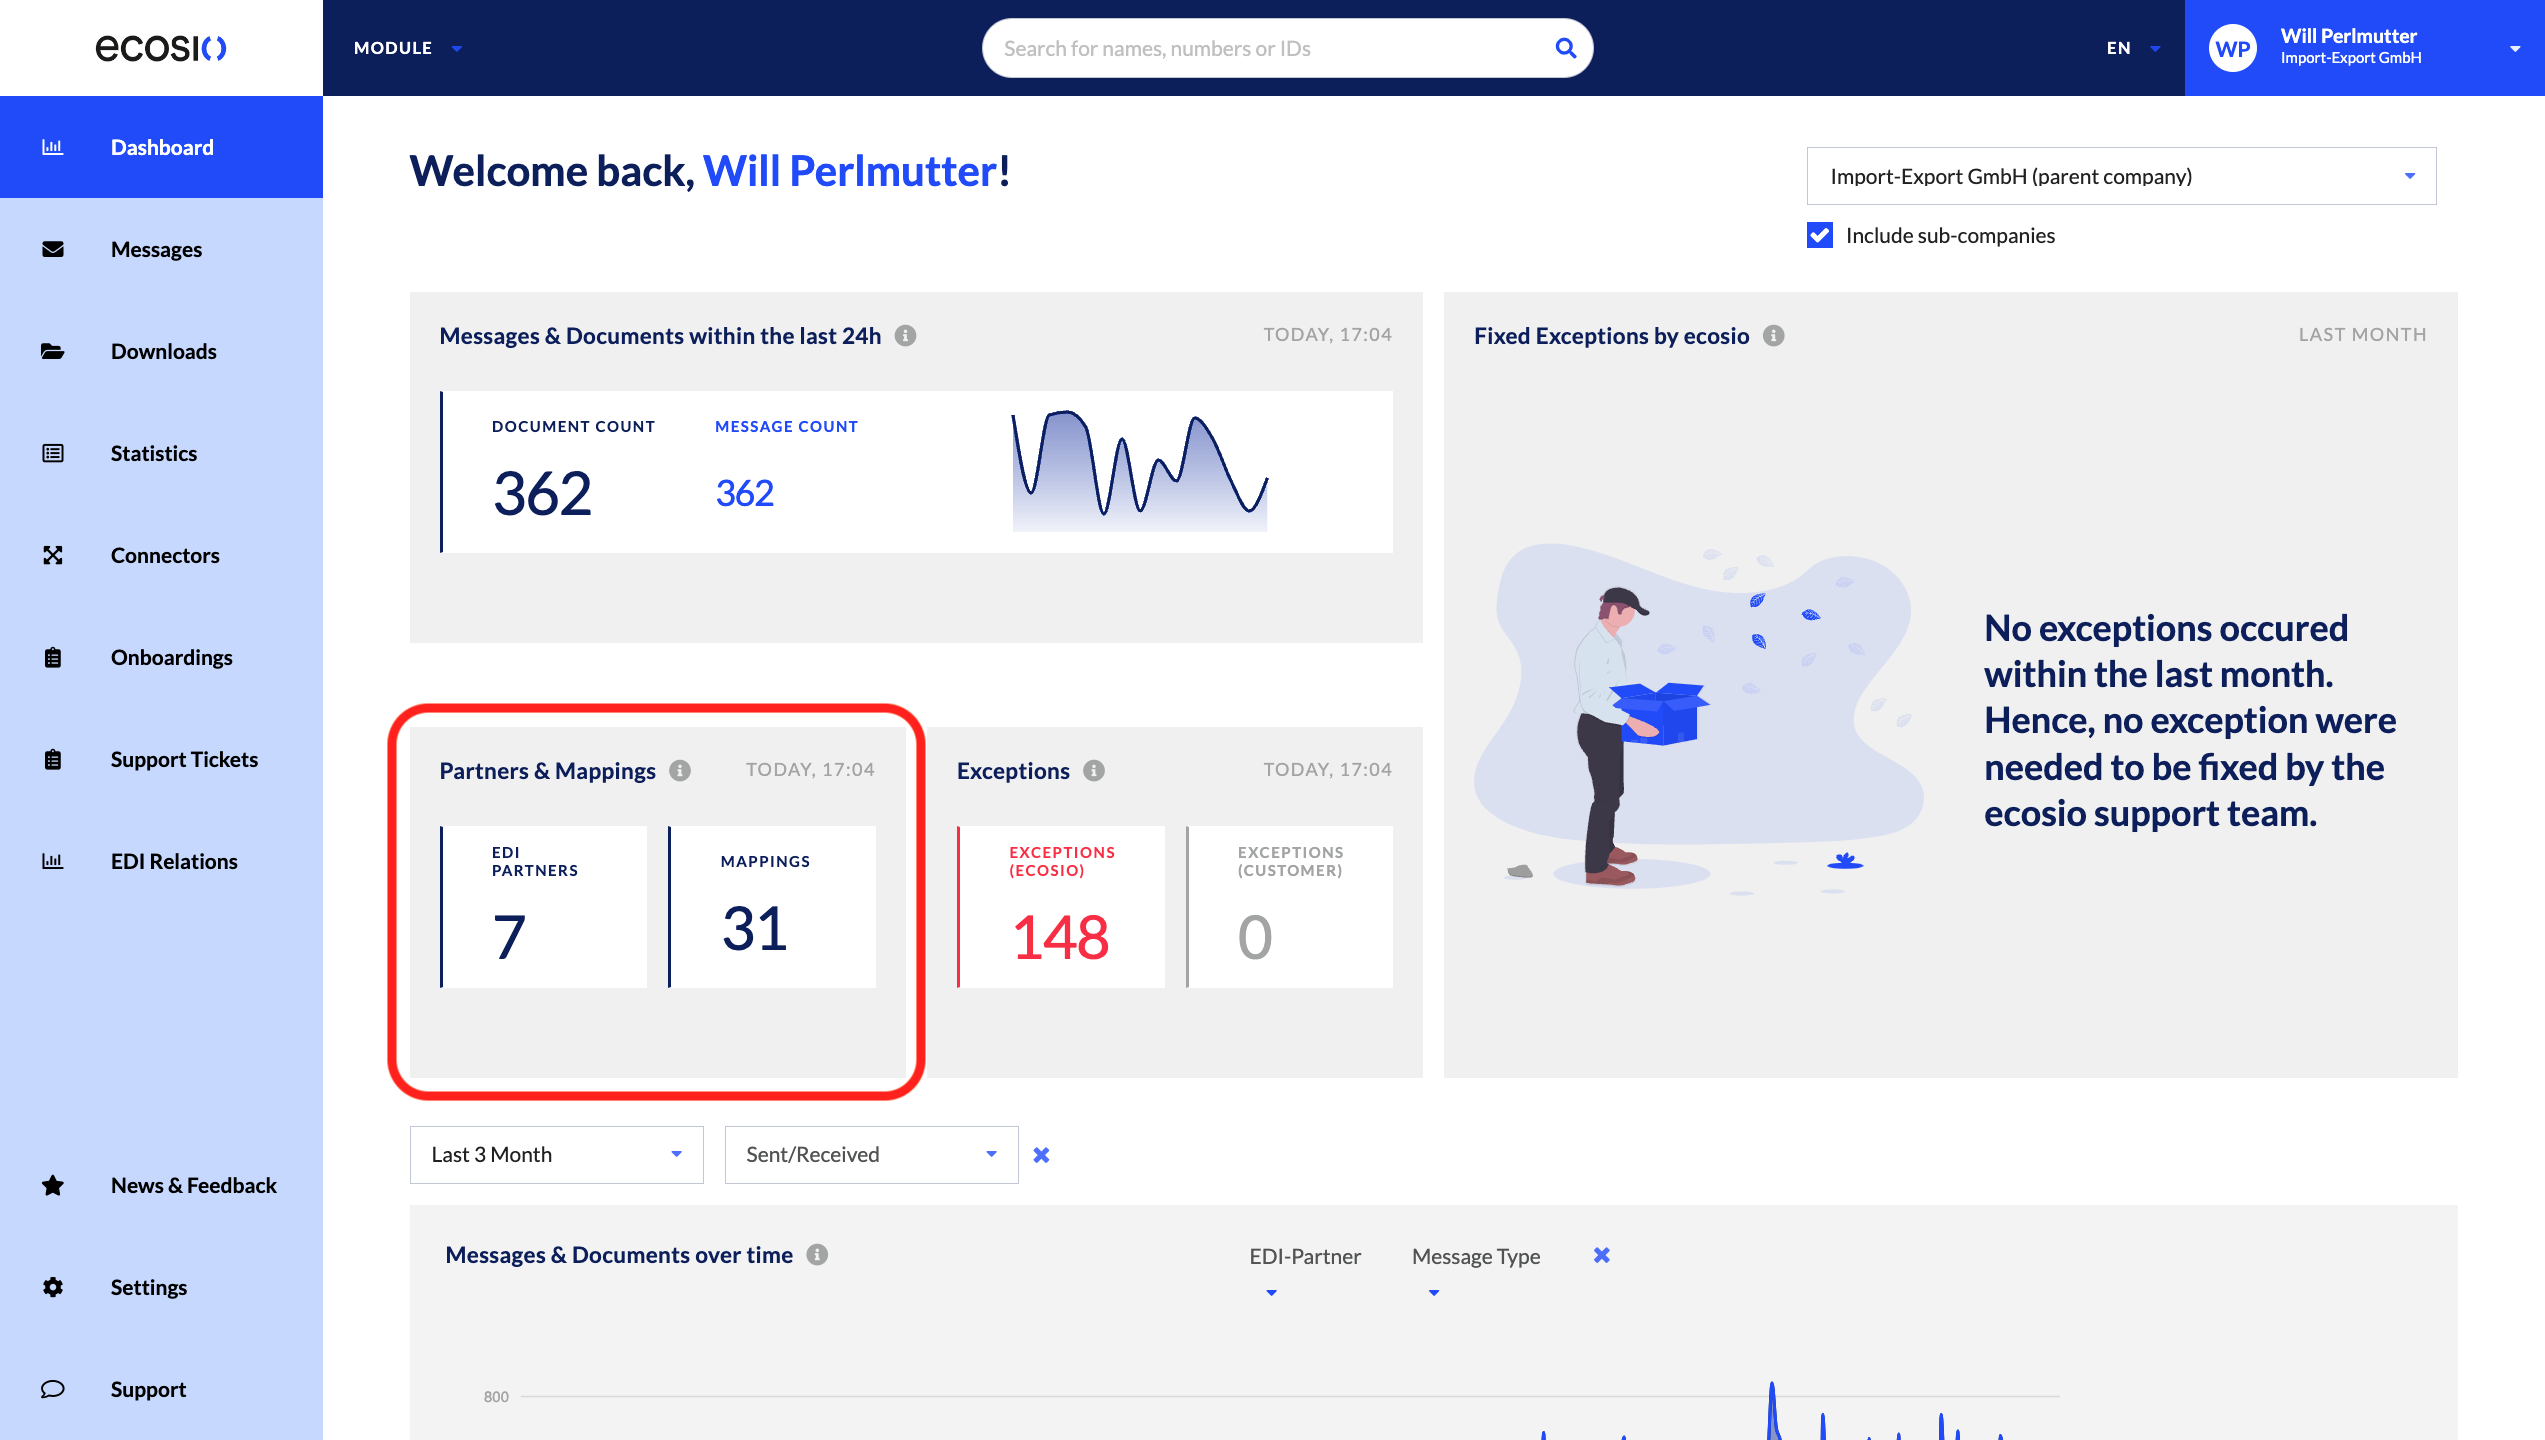
Do note that only the EDI partners section is clickable, and will reroute you to the EDI relations menu entry, as shown below:
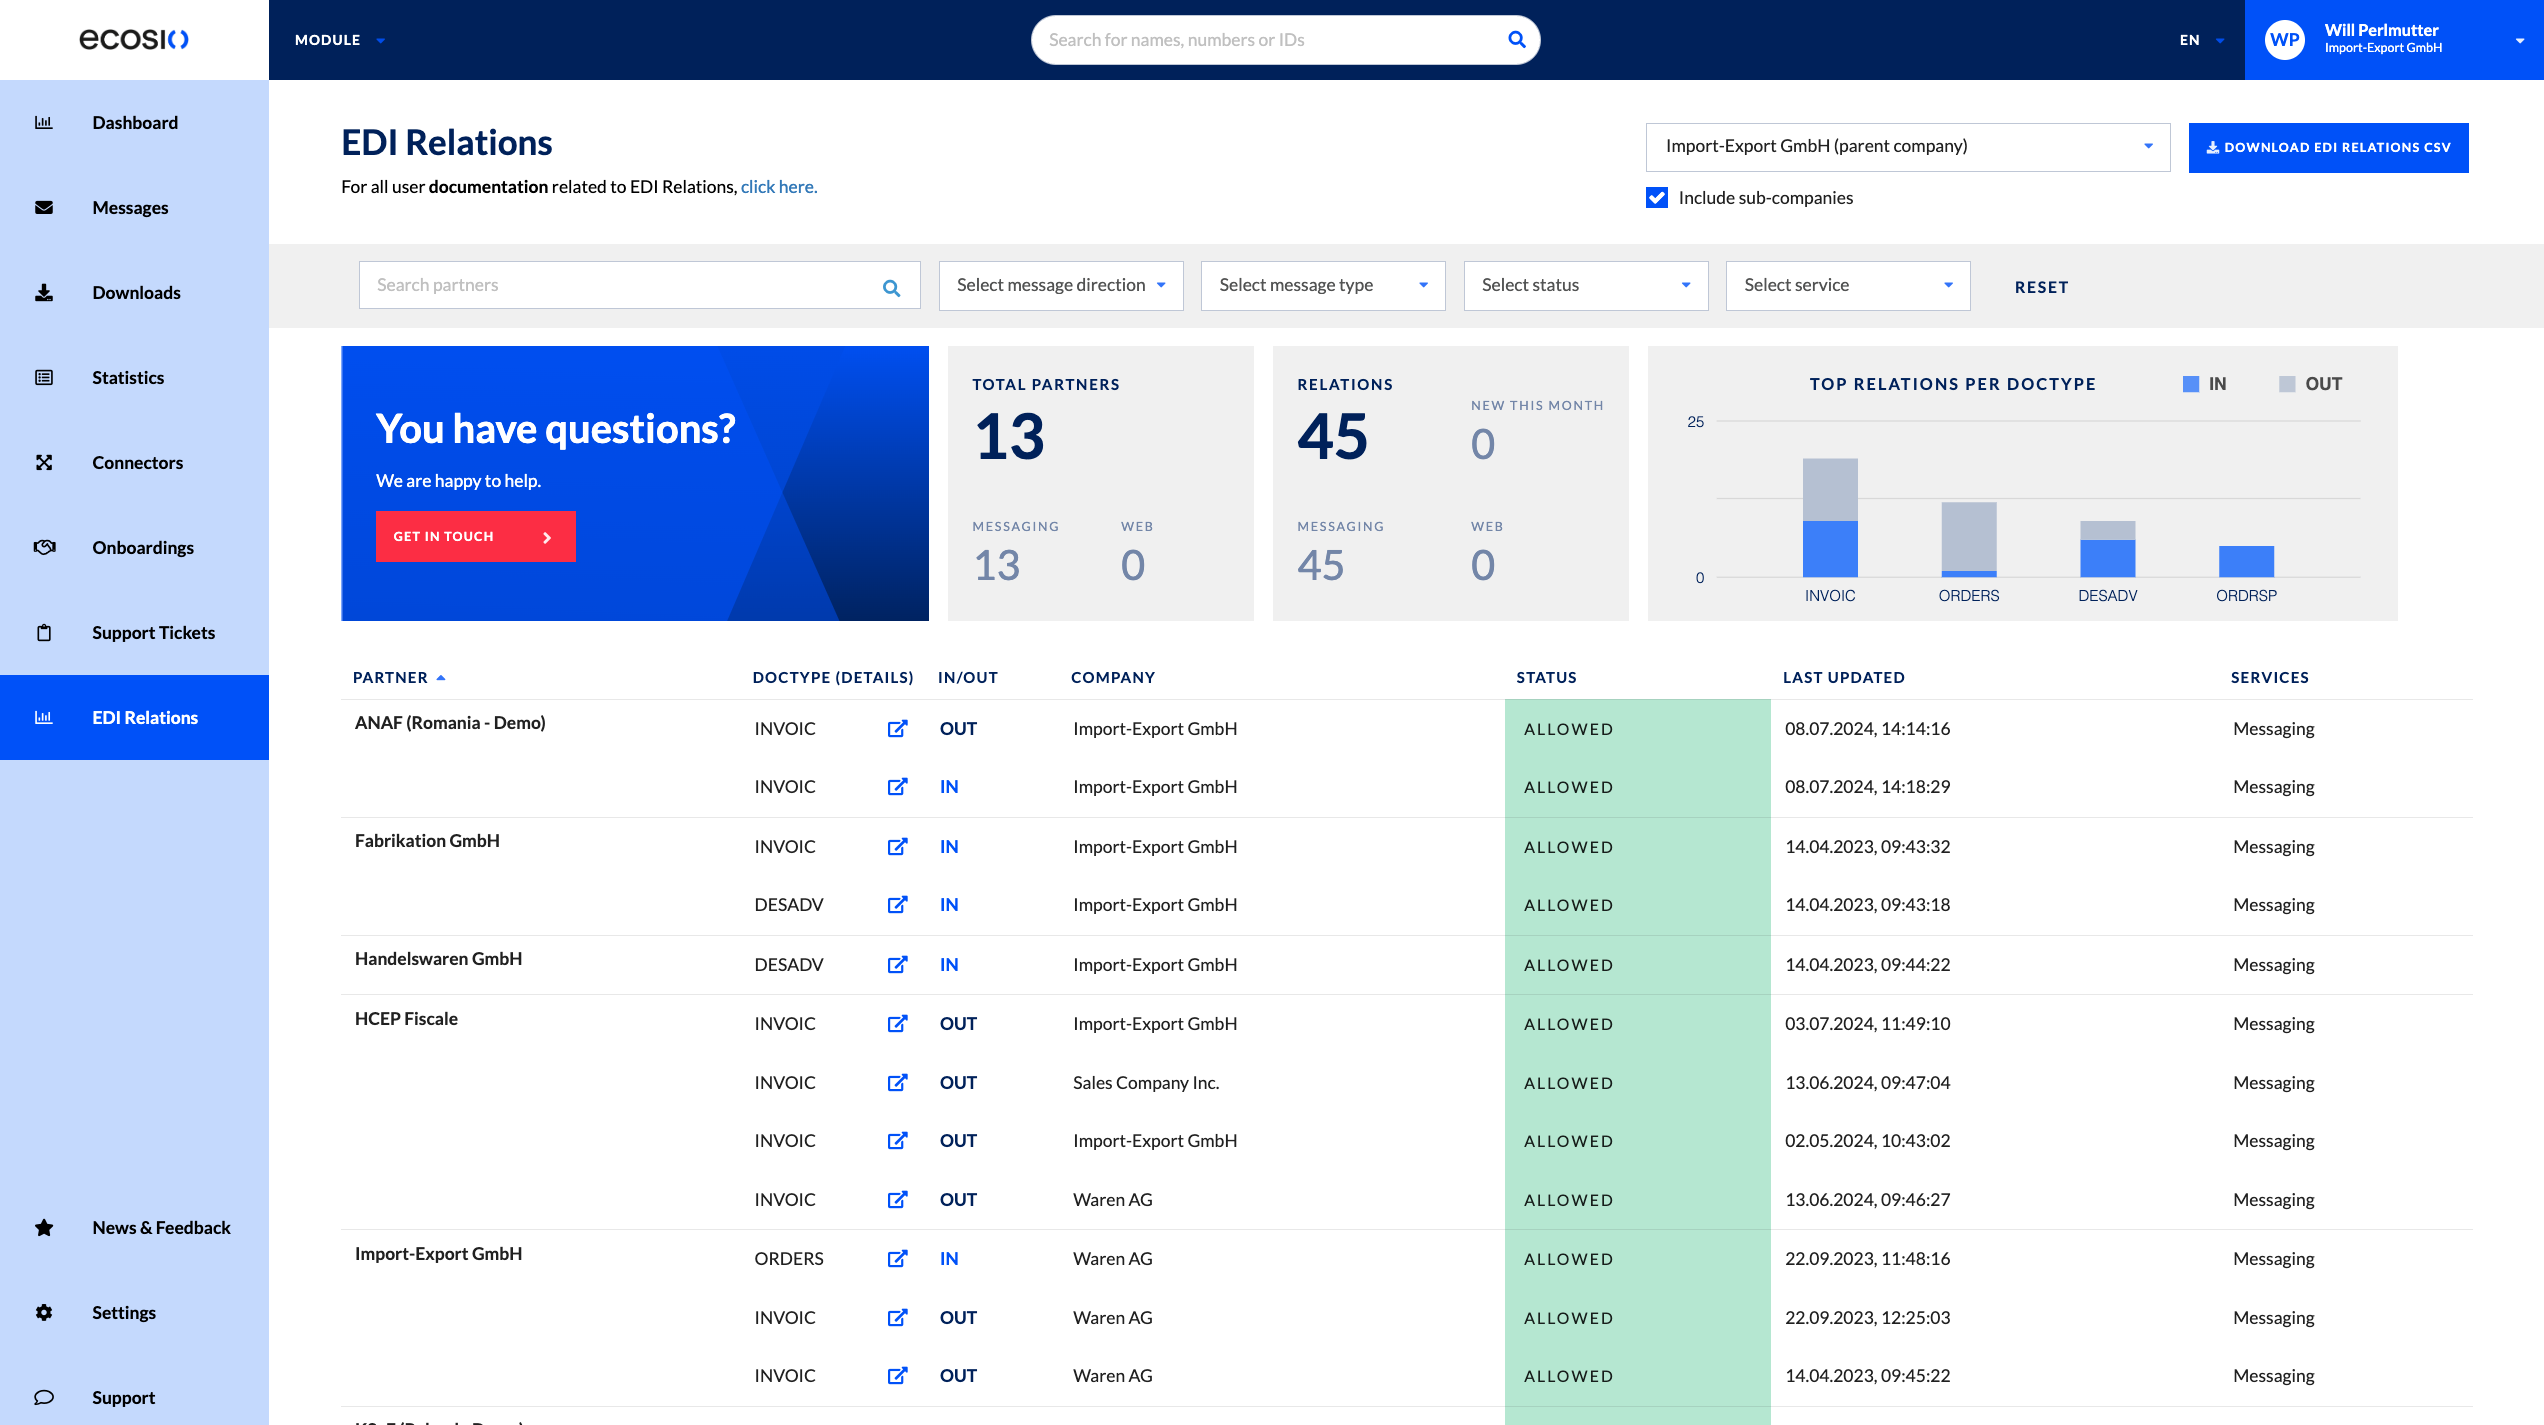
Exceptions
Users can see how many exception messages have been identified by the Monitor.
This is shown below:
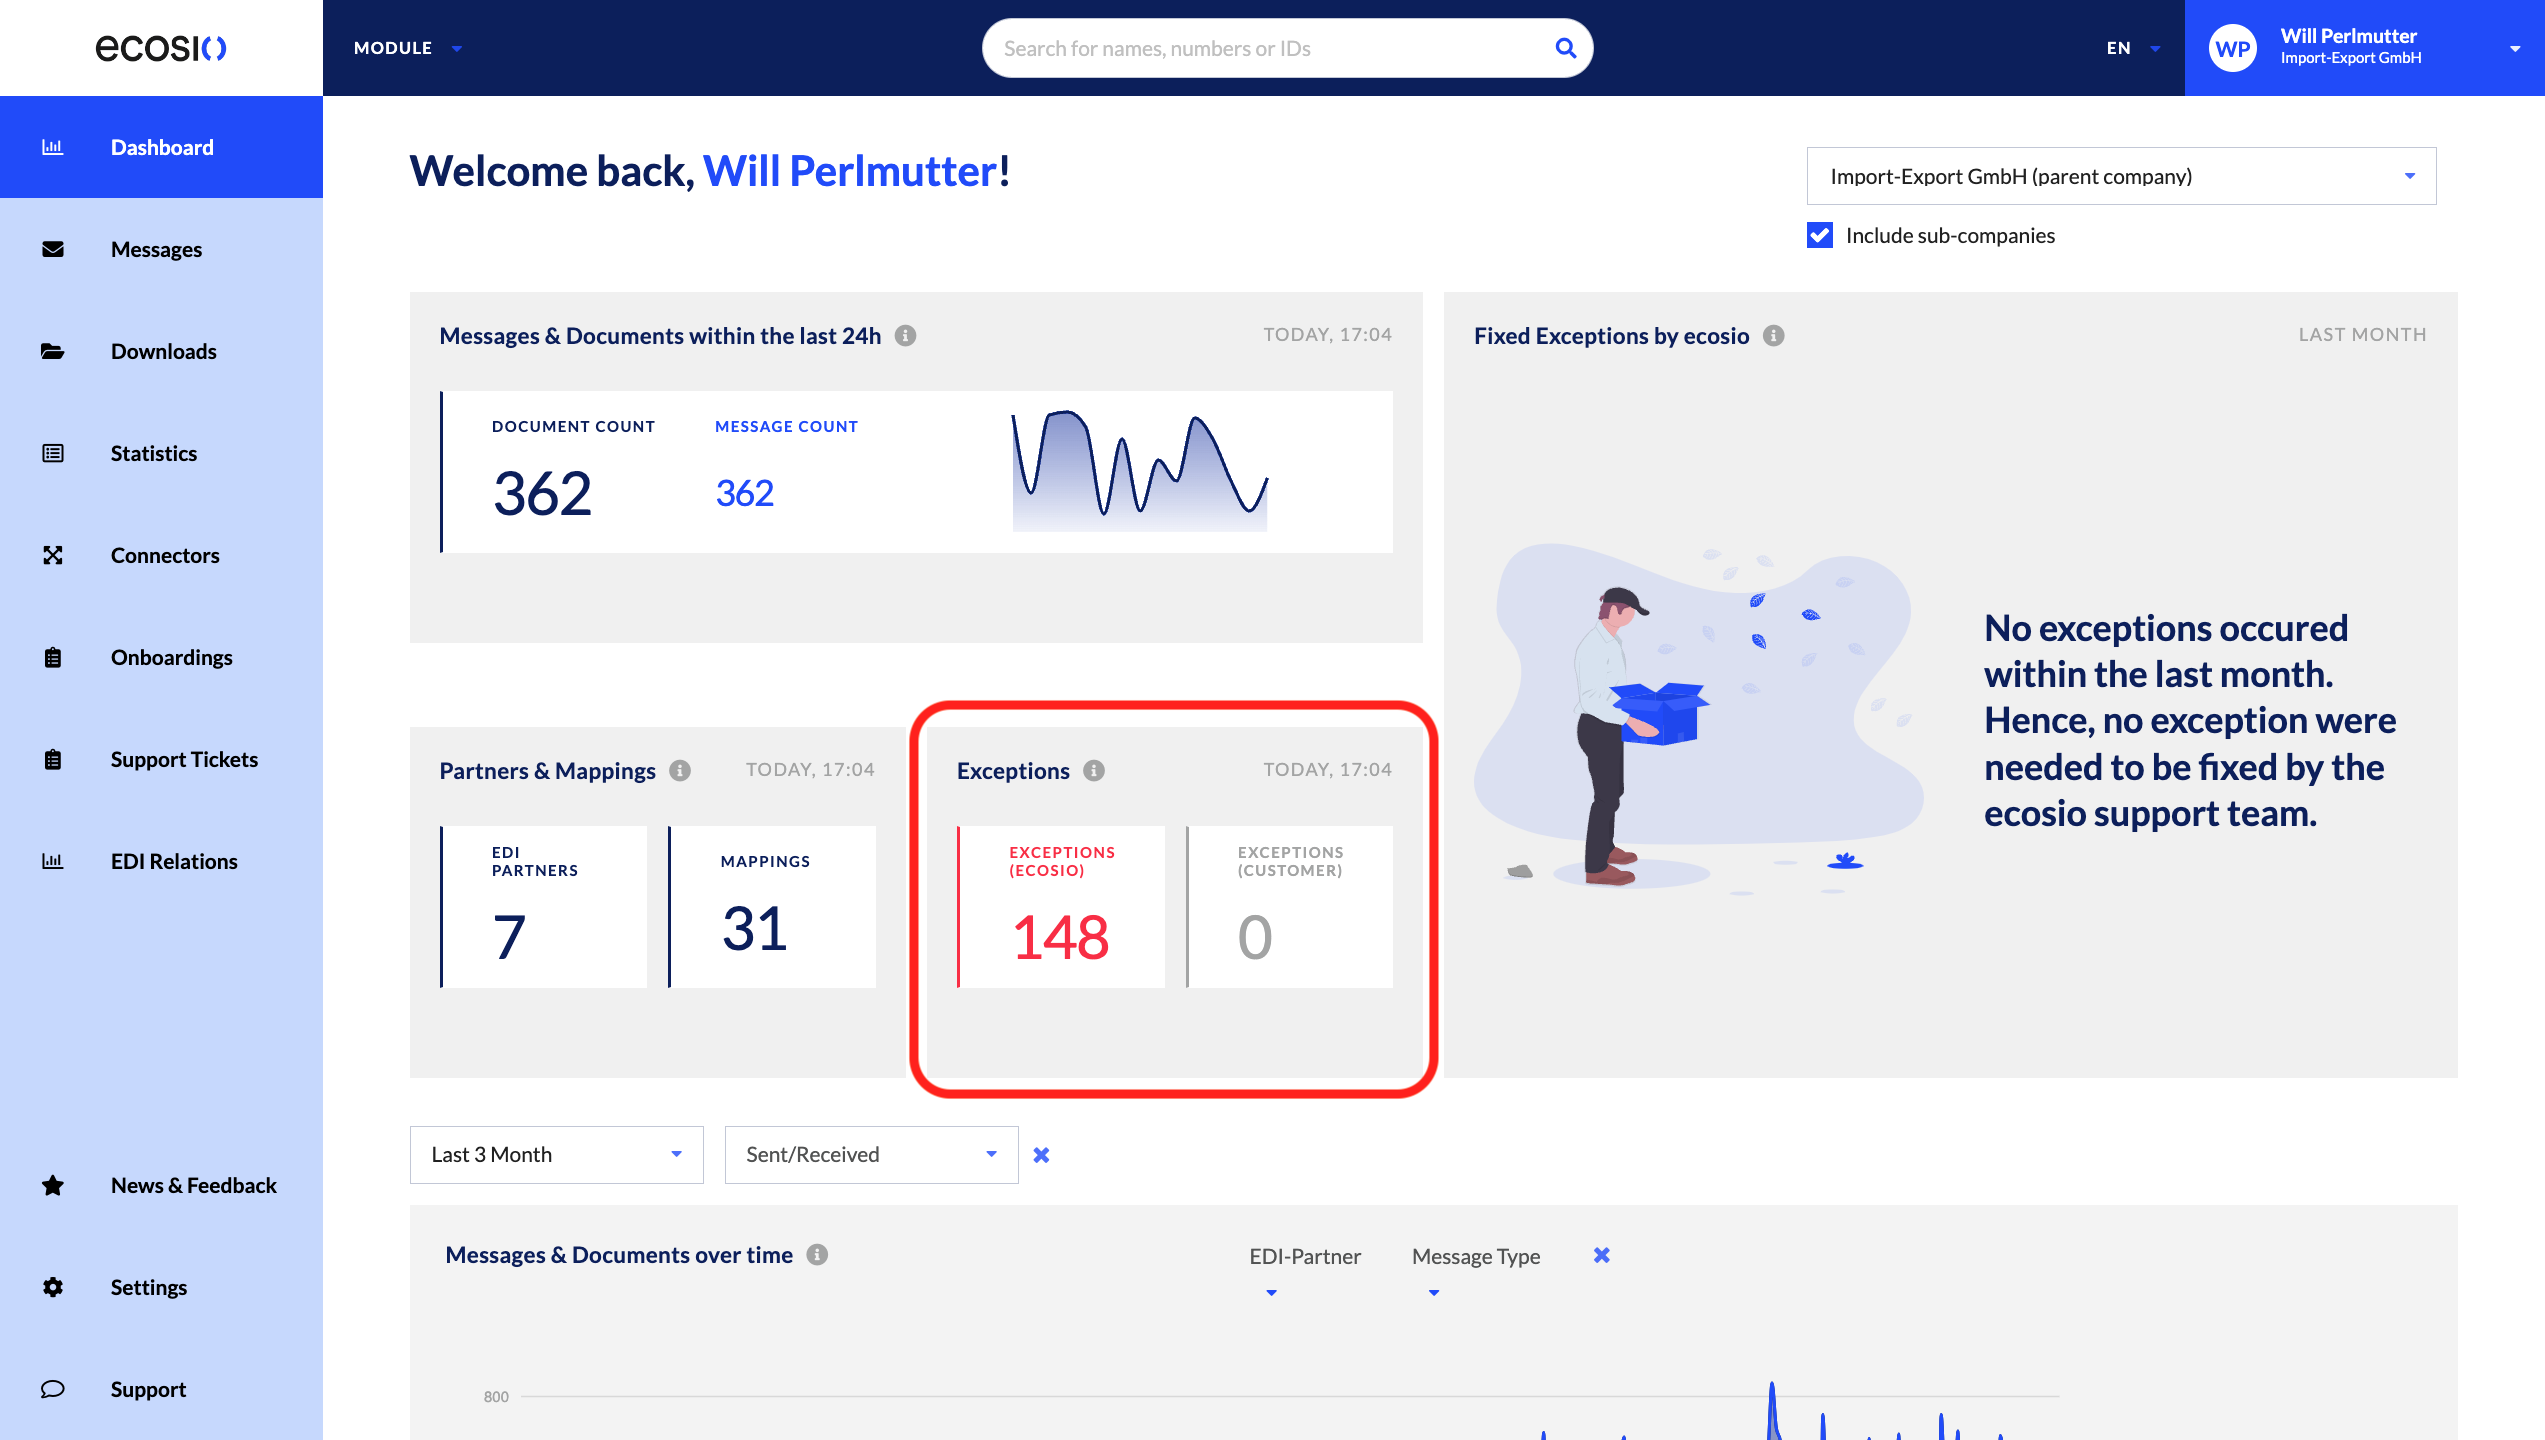
Exceptions come in two forms: ecosio and customer. Definitions of both are listed below:
- Exception (ecosio):
The message is currently in an error state. Our ecosio support team has already been notified and will take care of it. We will contact you if required for mitigation. - Exception (customer):
The message is currently in an error state, which the customer needs to take care of. This is typically related to incorrect master data or double submission of the same message, etc.
When there are exception messages, users can also select the message counts, where they will be taken to the Message Overview page to view those exceptions. This is shown below:
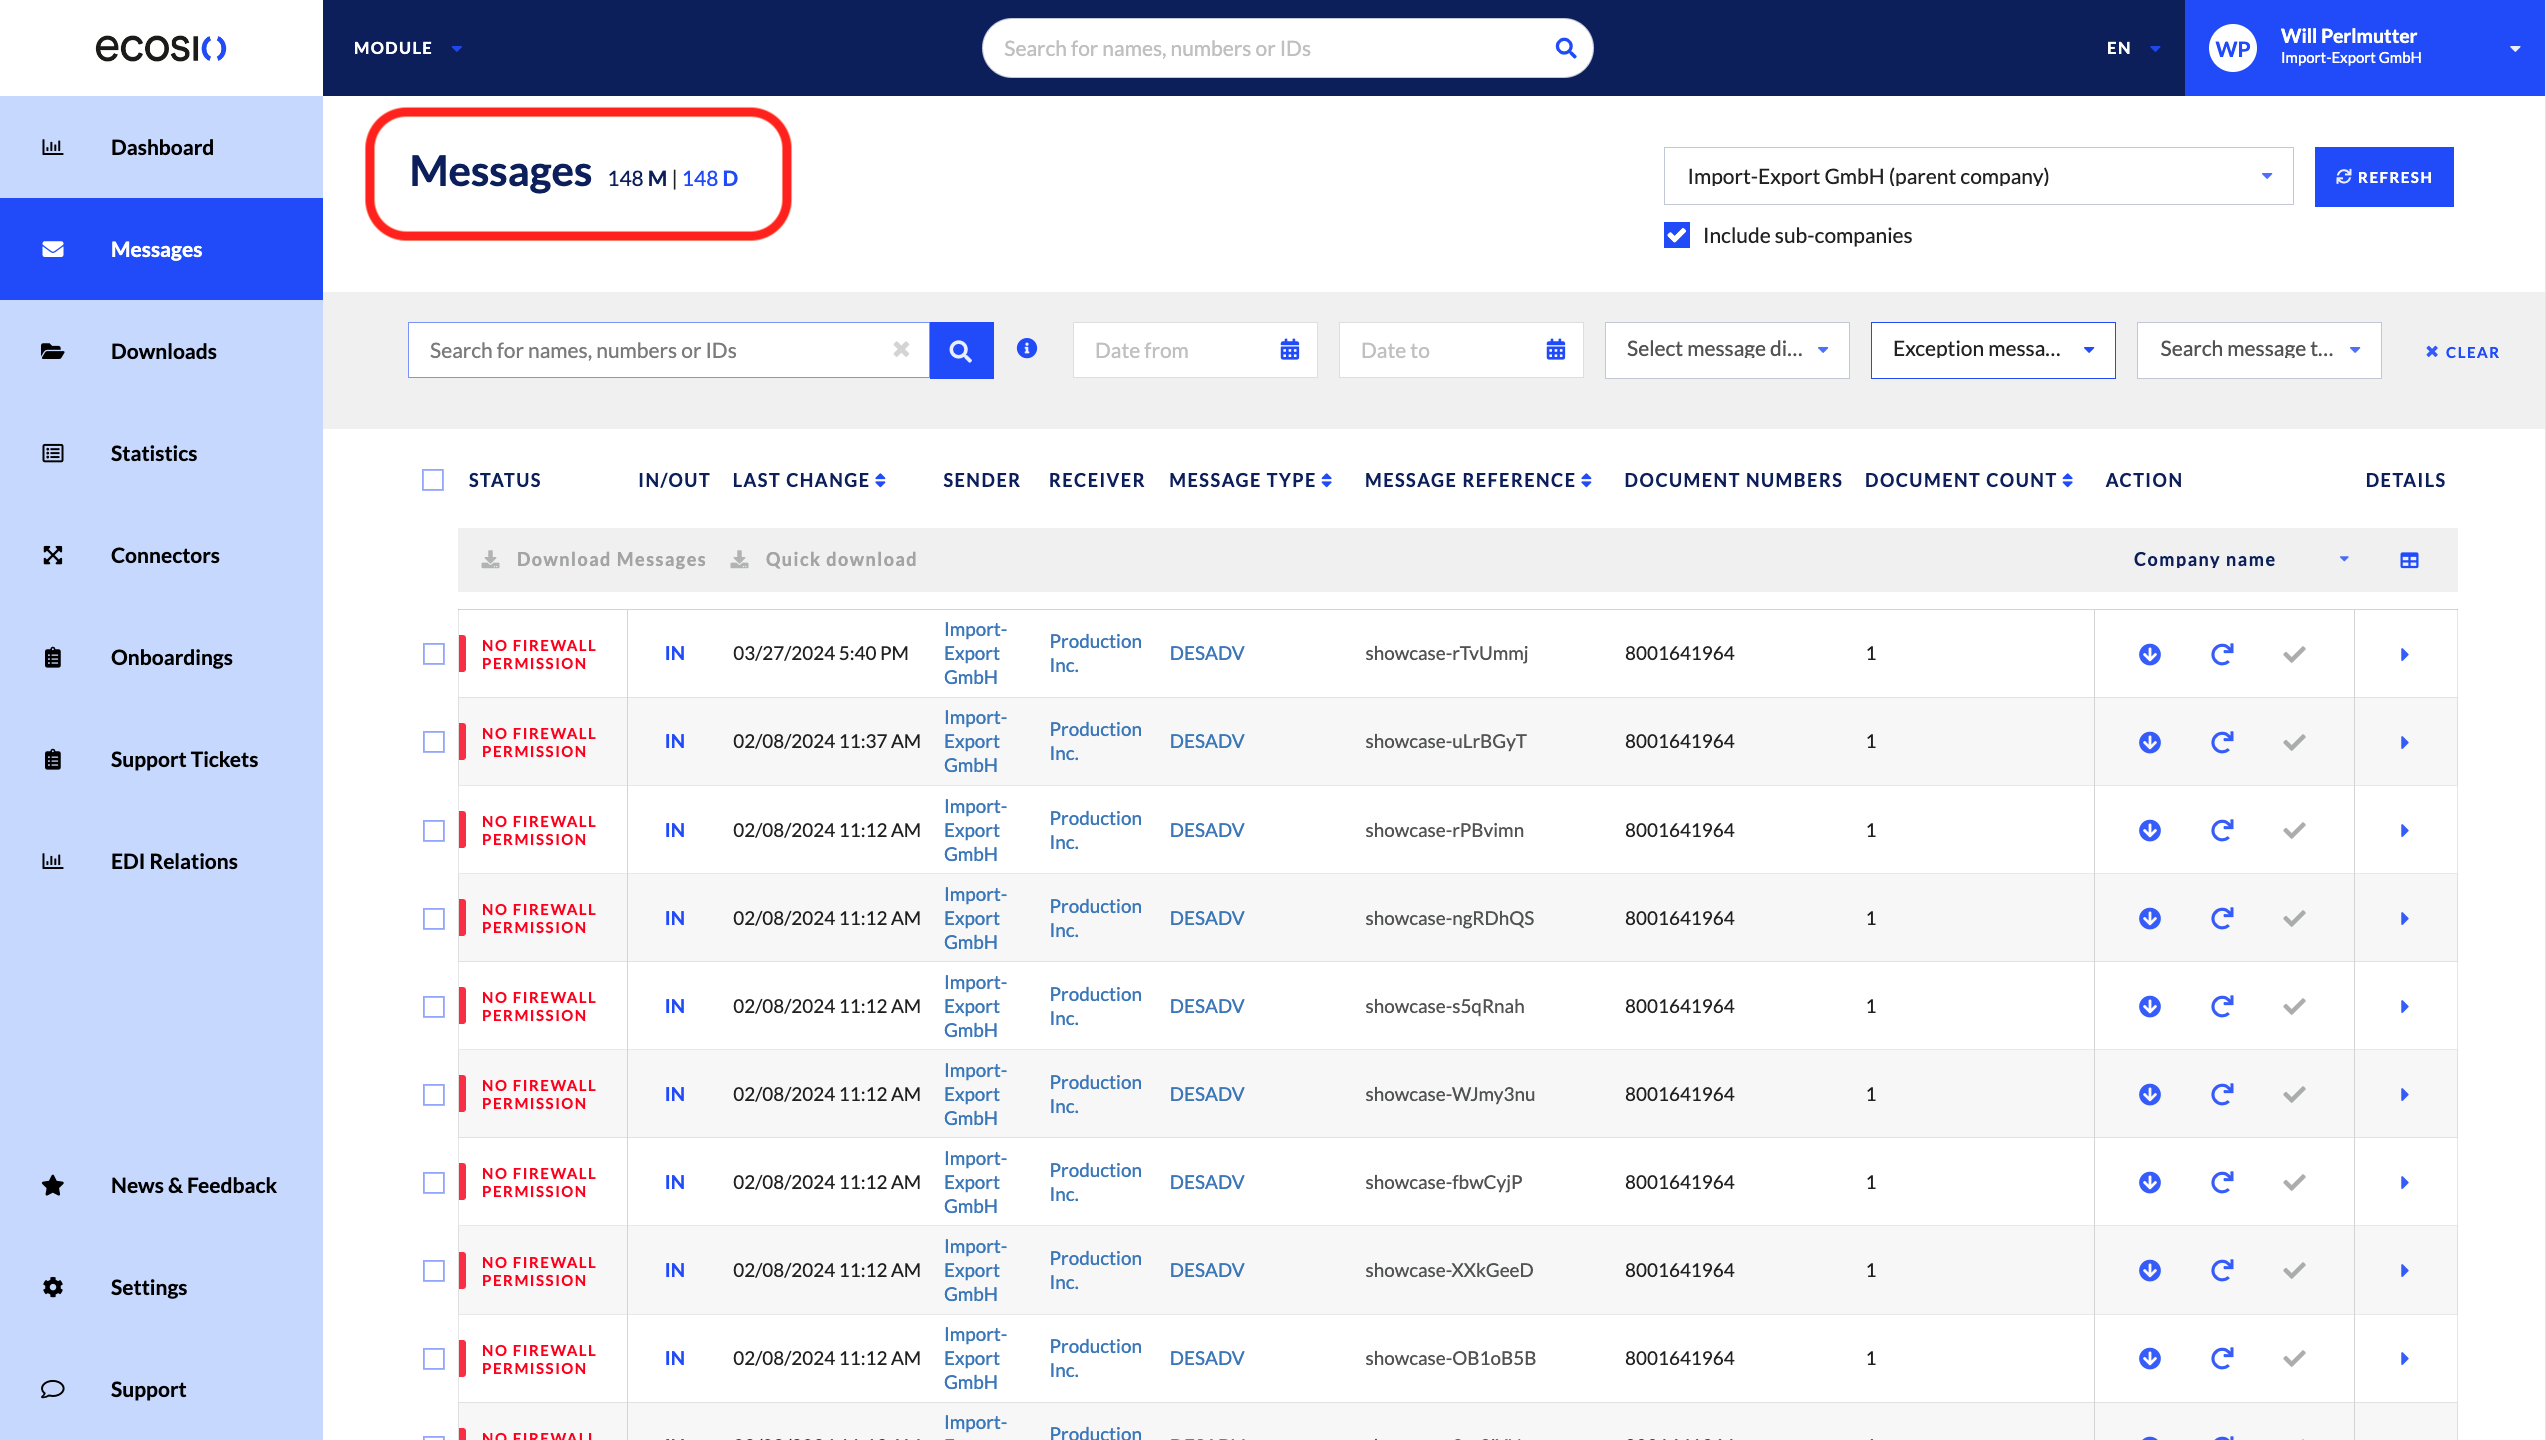
Fixed Exceptions by ecosio
When the ecosio team has fixed an exception, these messages are displayed in this section shown below:
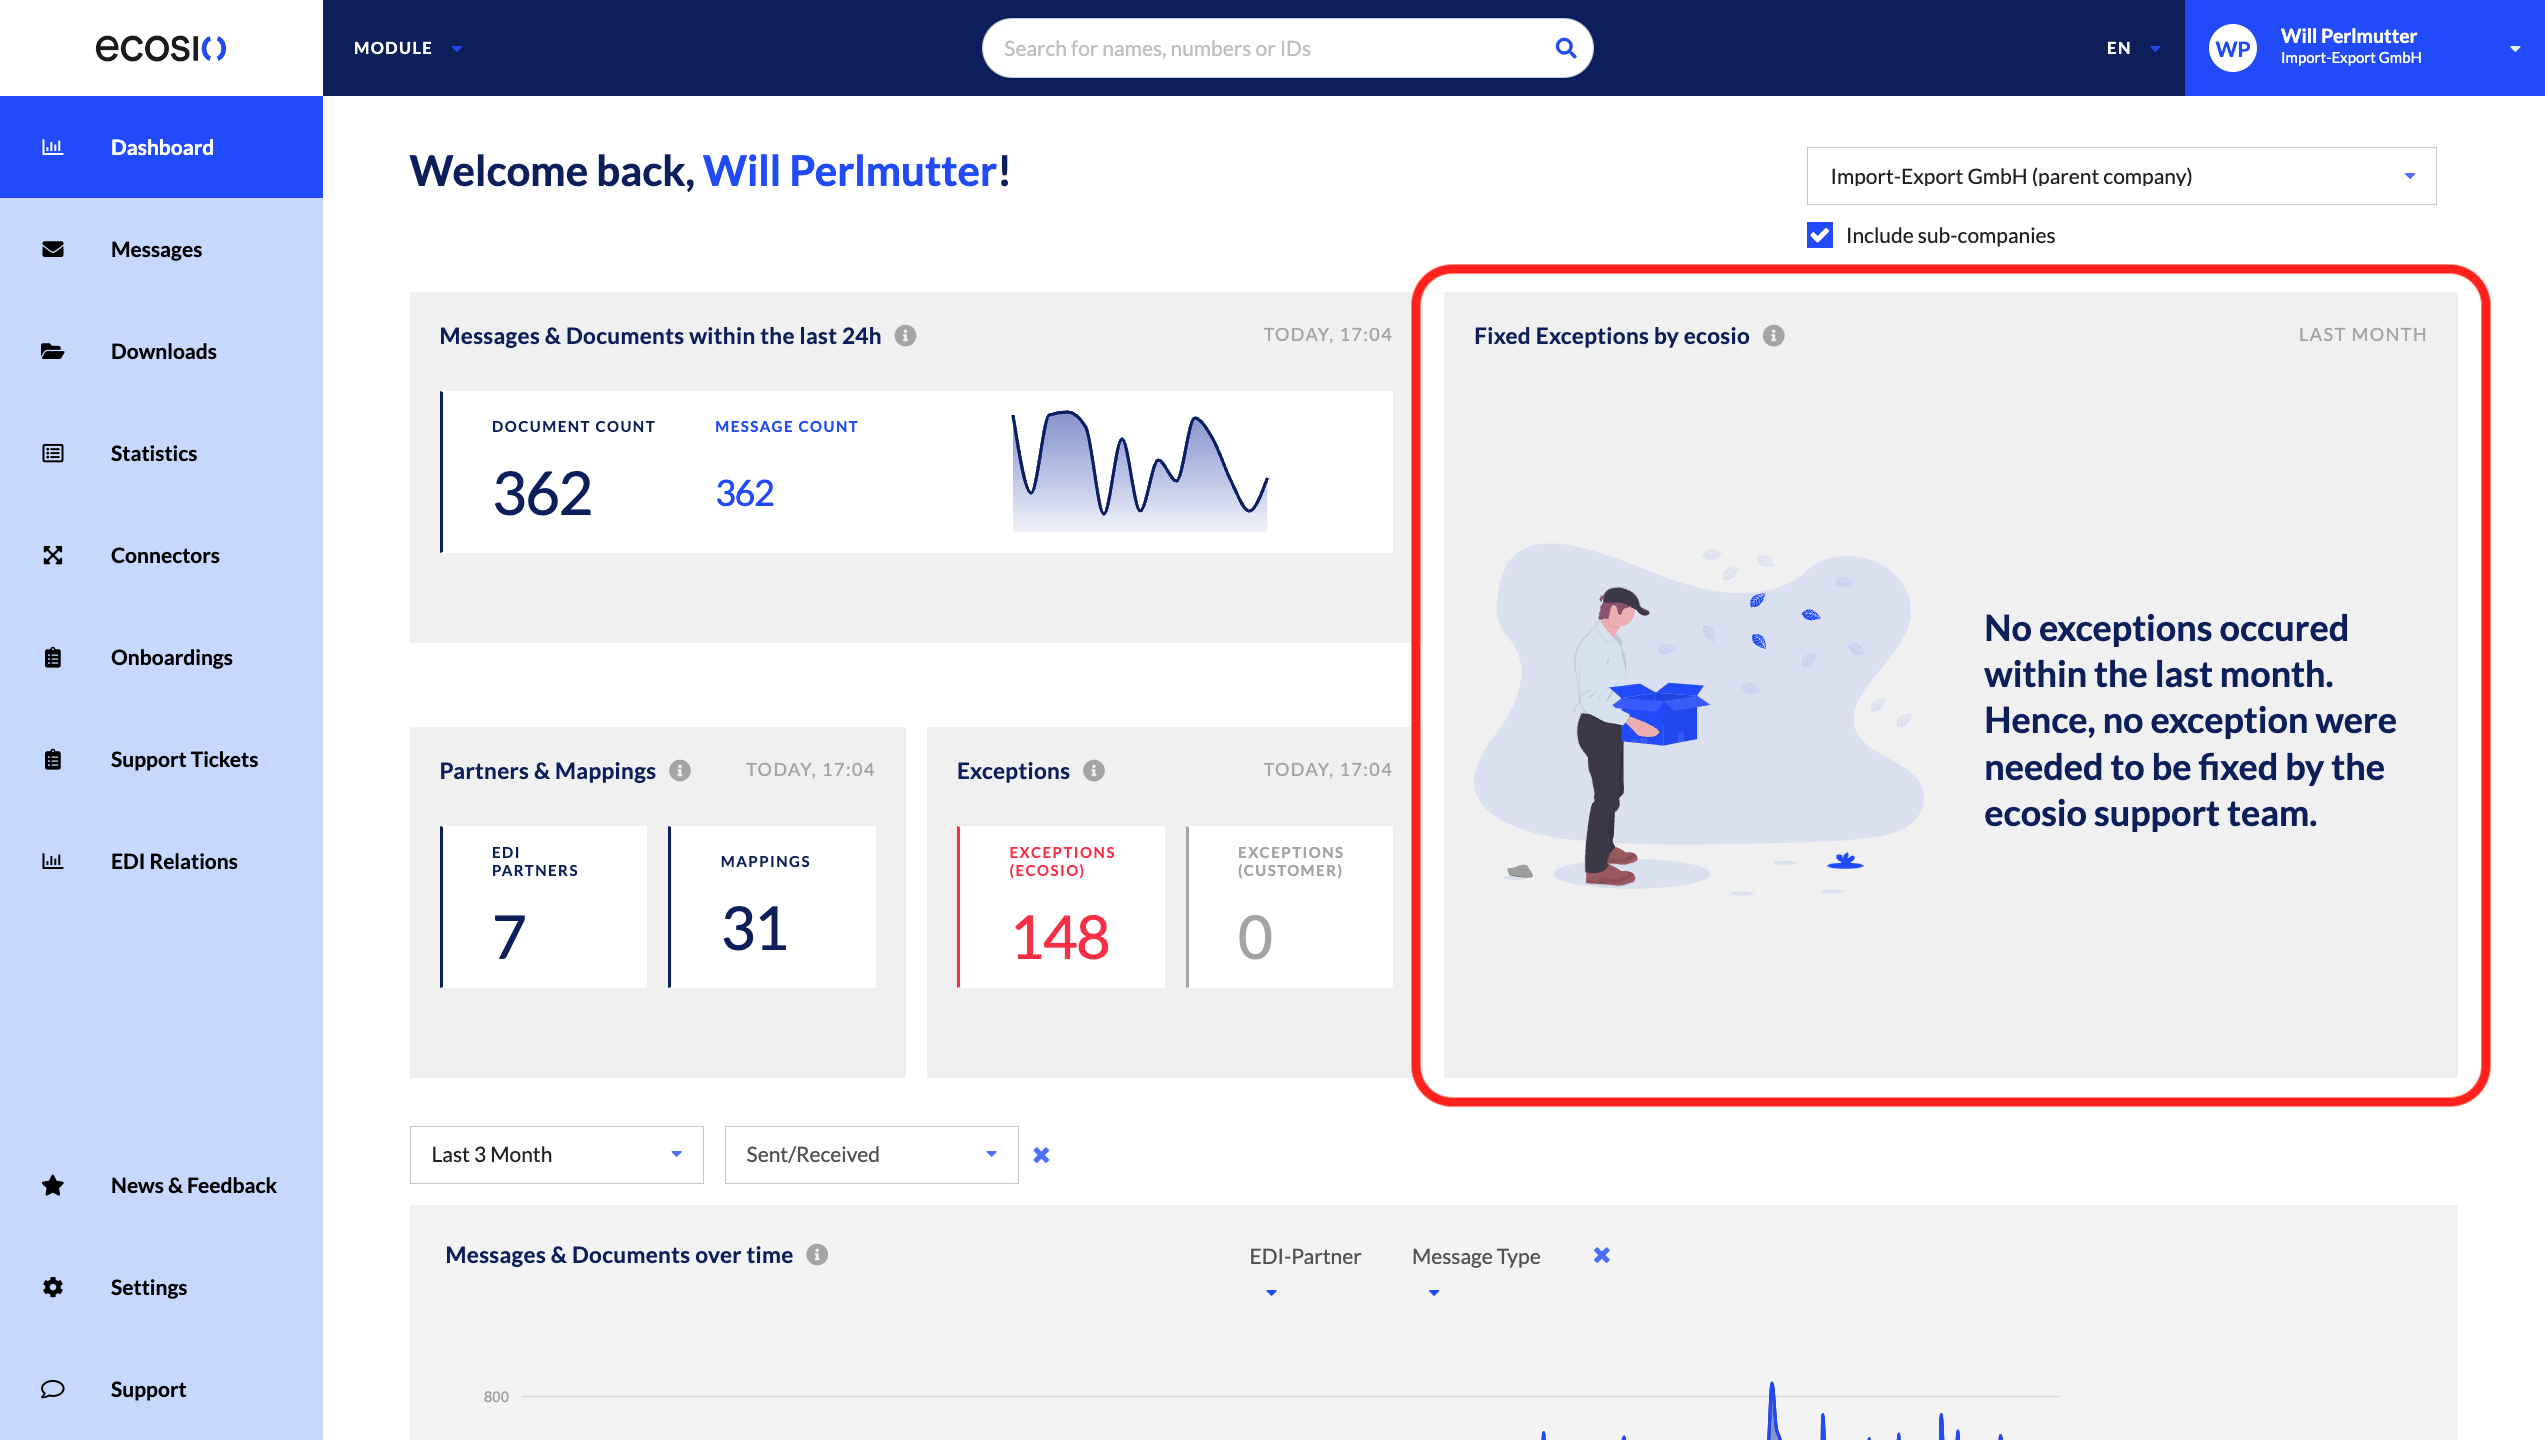
In the image above, there are currently no exceptions fixed by ecosio in the image above.
Messages & Documents over time
By scrolling down, users can view messages, documents and exceptions on a line graph:
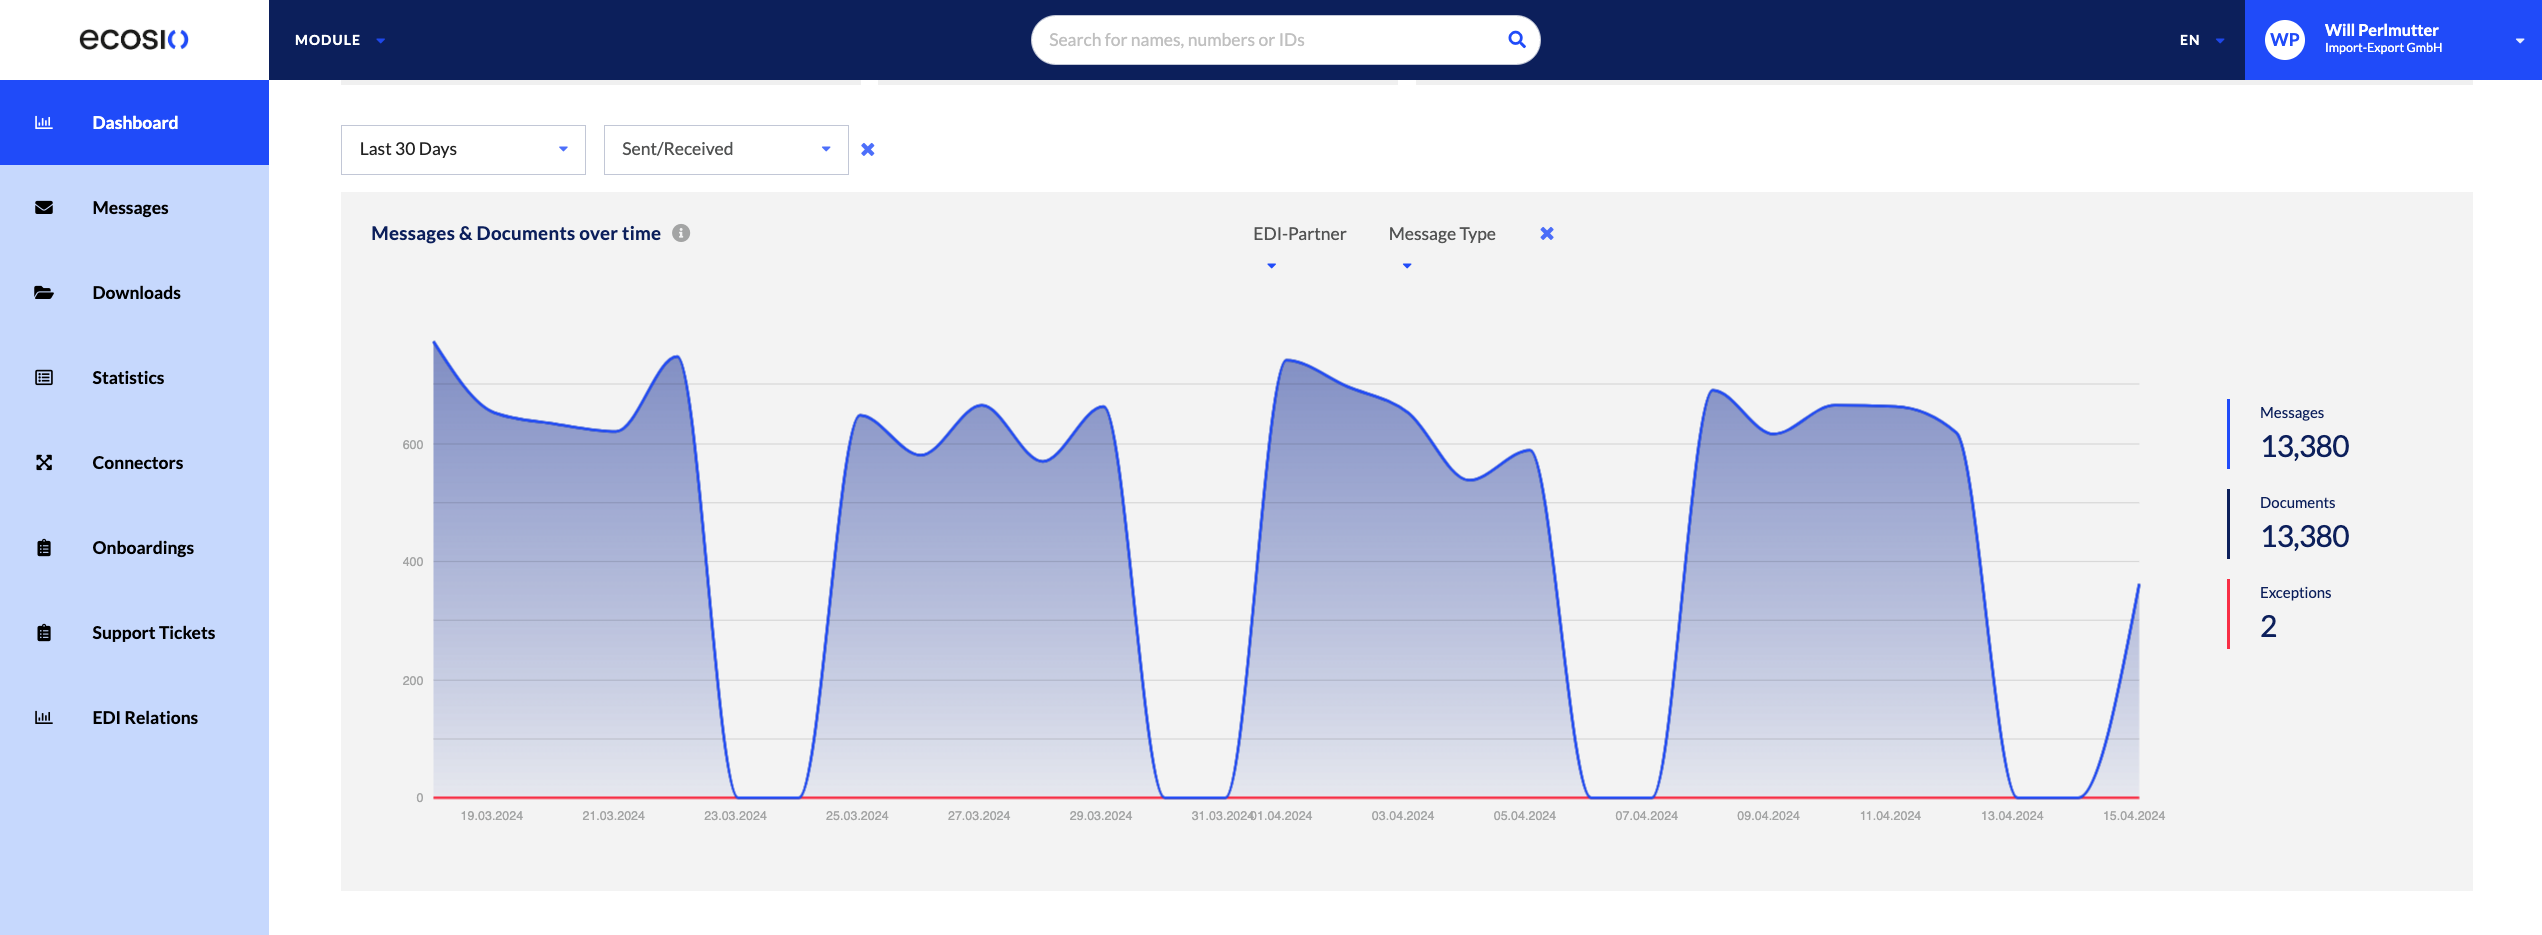
As shown above and to the far right, users can view the total messages, documents and exceptions during that time period as well.
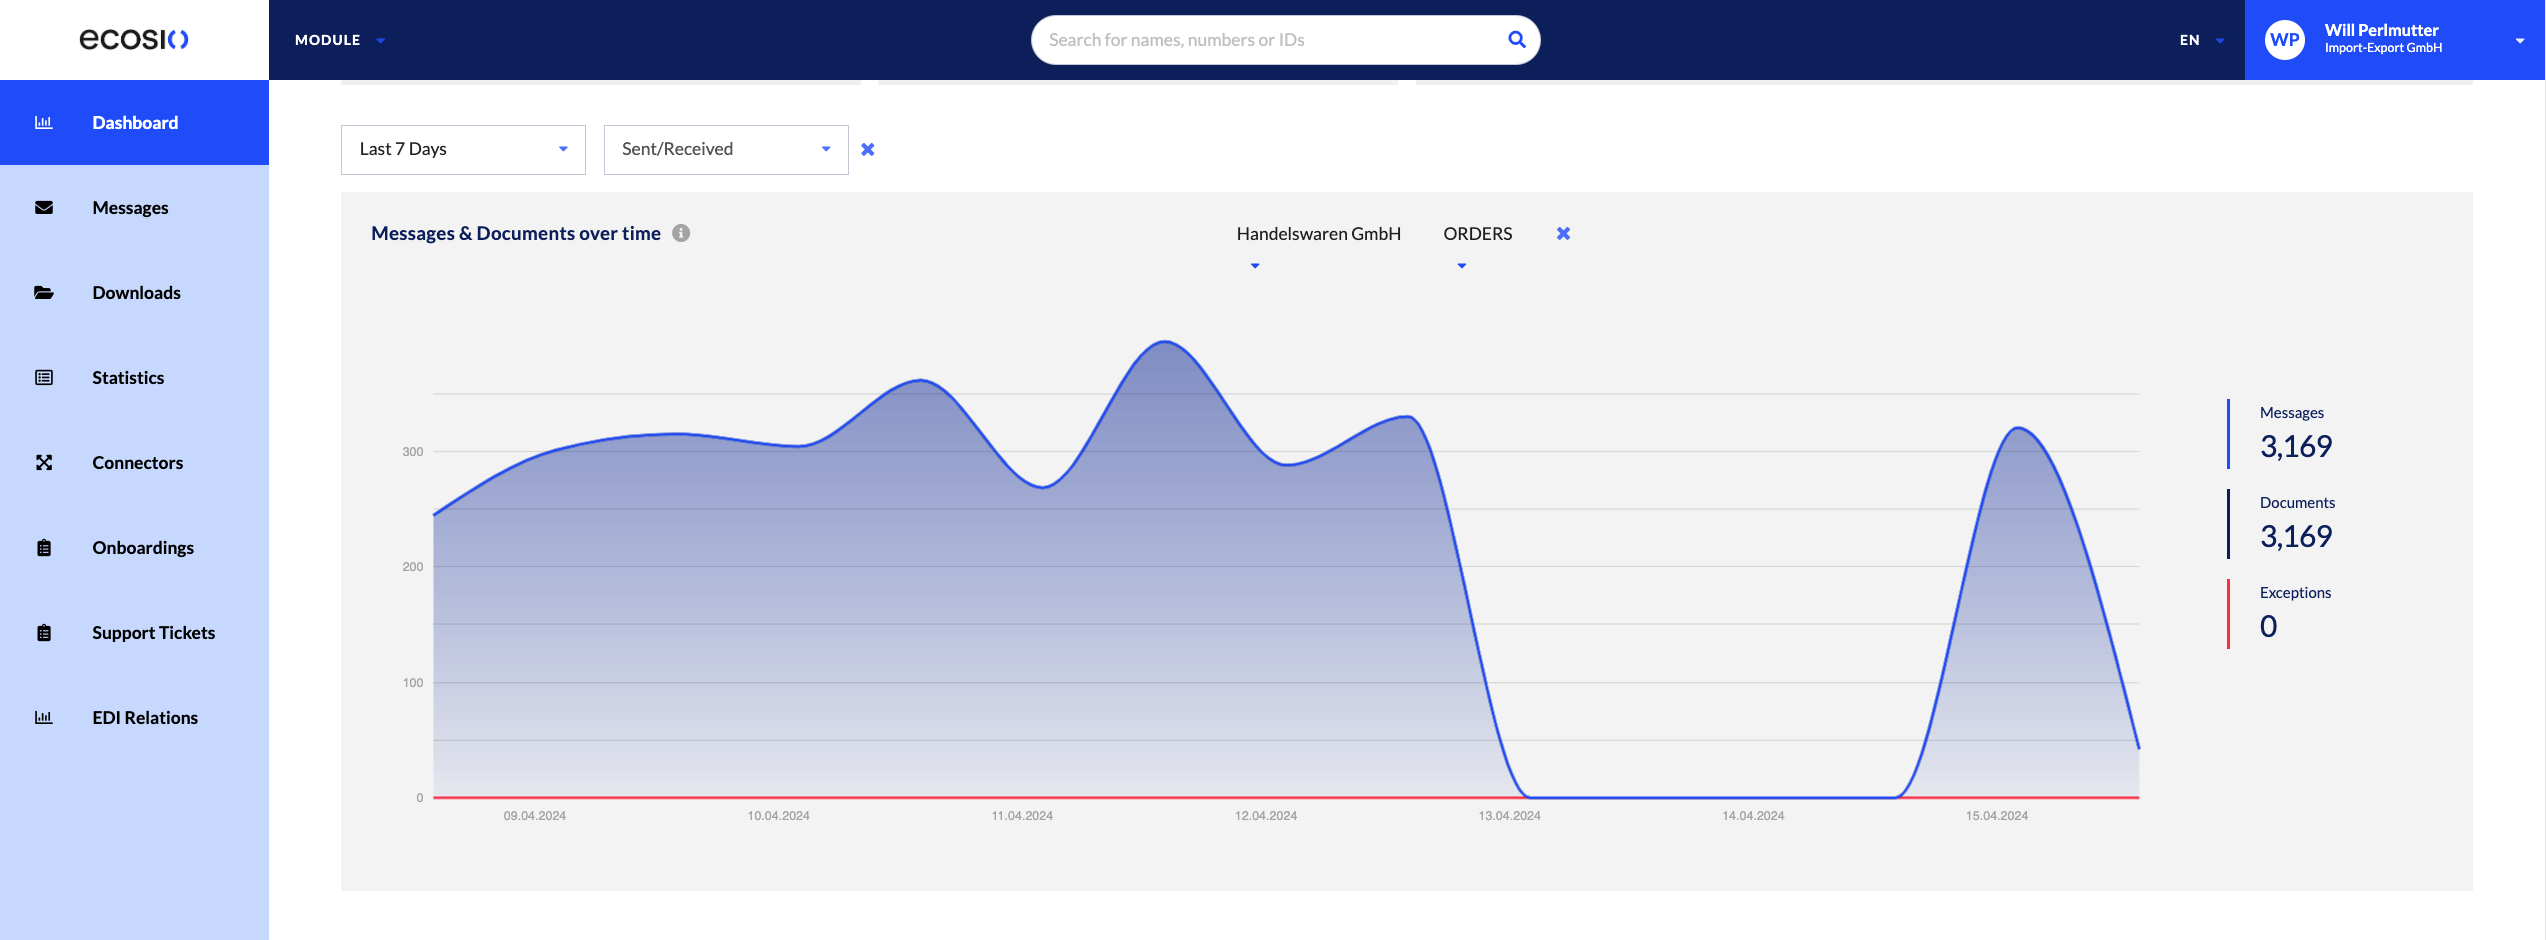
You can filter based on time (up to the last 3 months), as well as if the messages were sent or received. This is shown below:
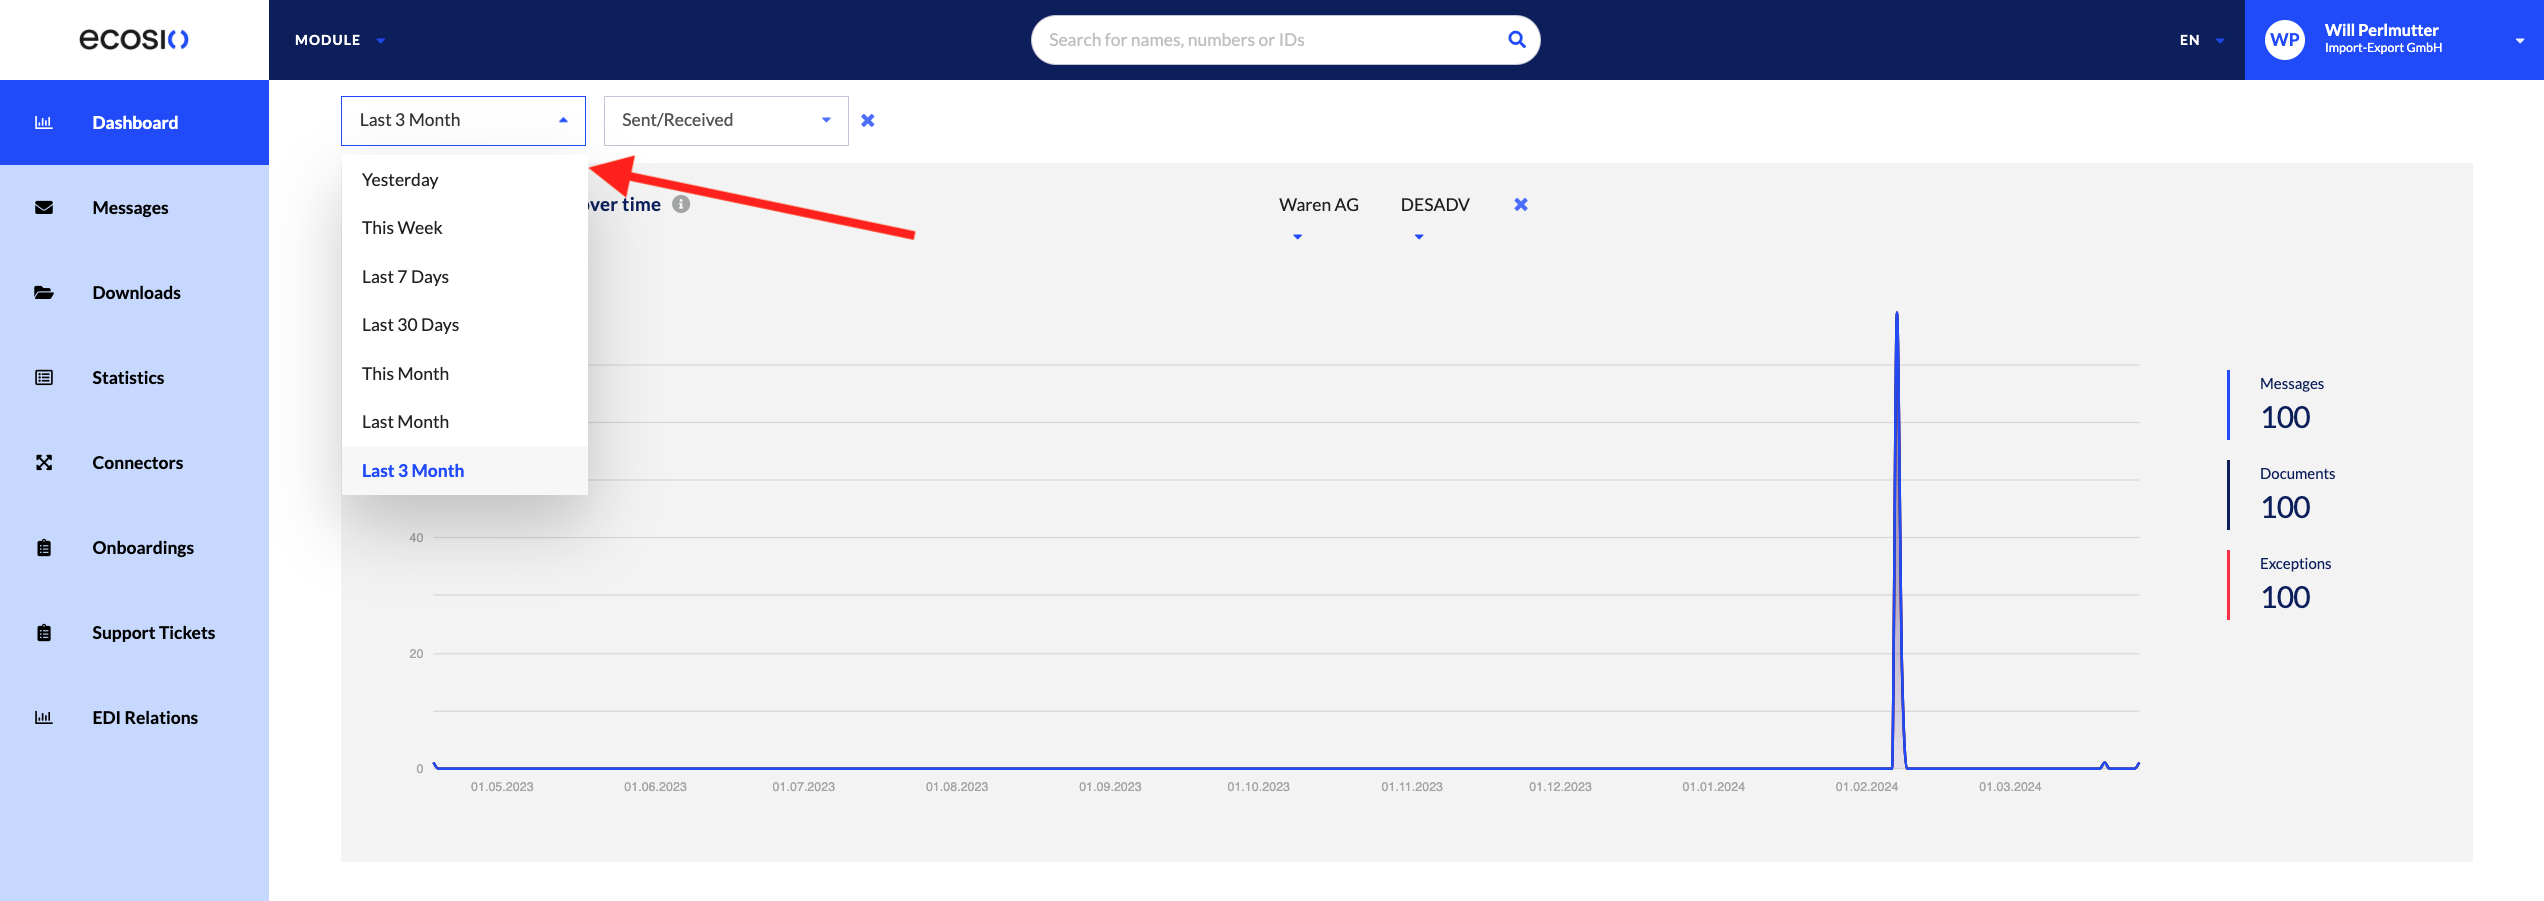
Additionally within the graph, users can drill down further and visualise messages, documents and exceptions based on EDI partners as well as message classification types. This is shown in the next two images below:
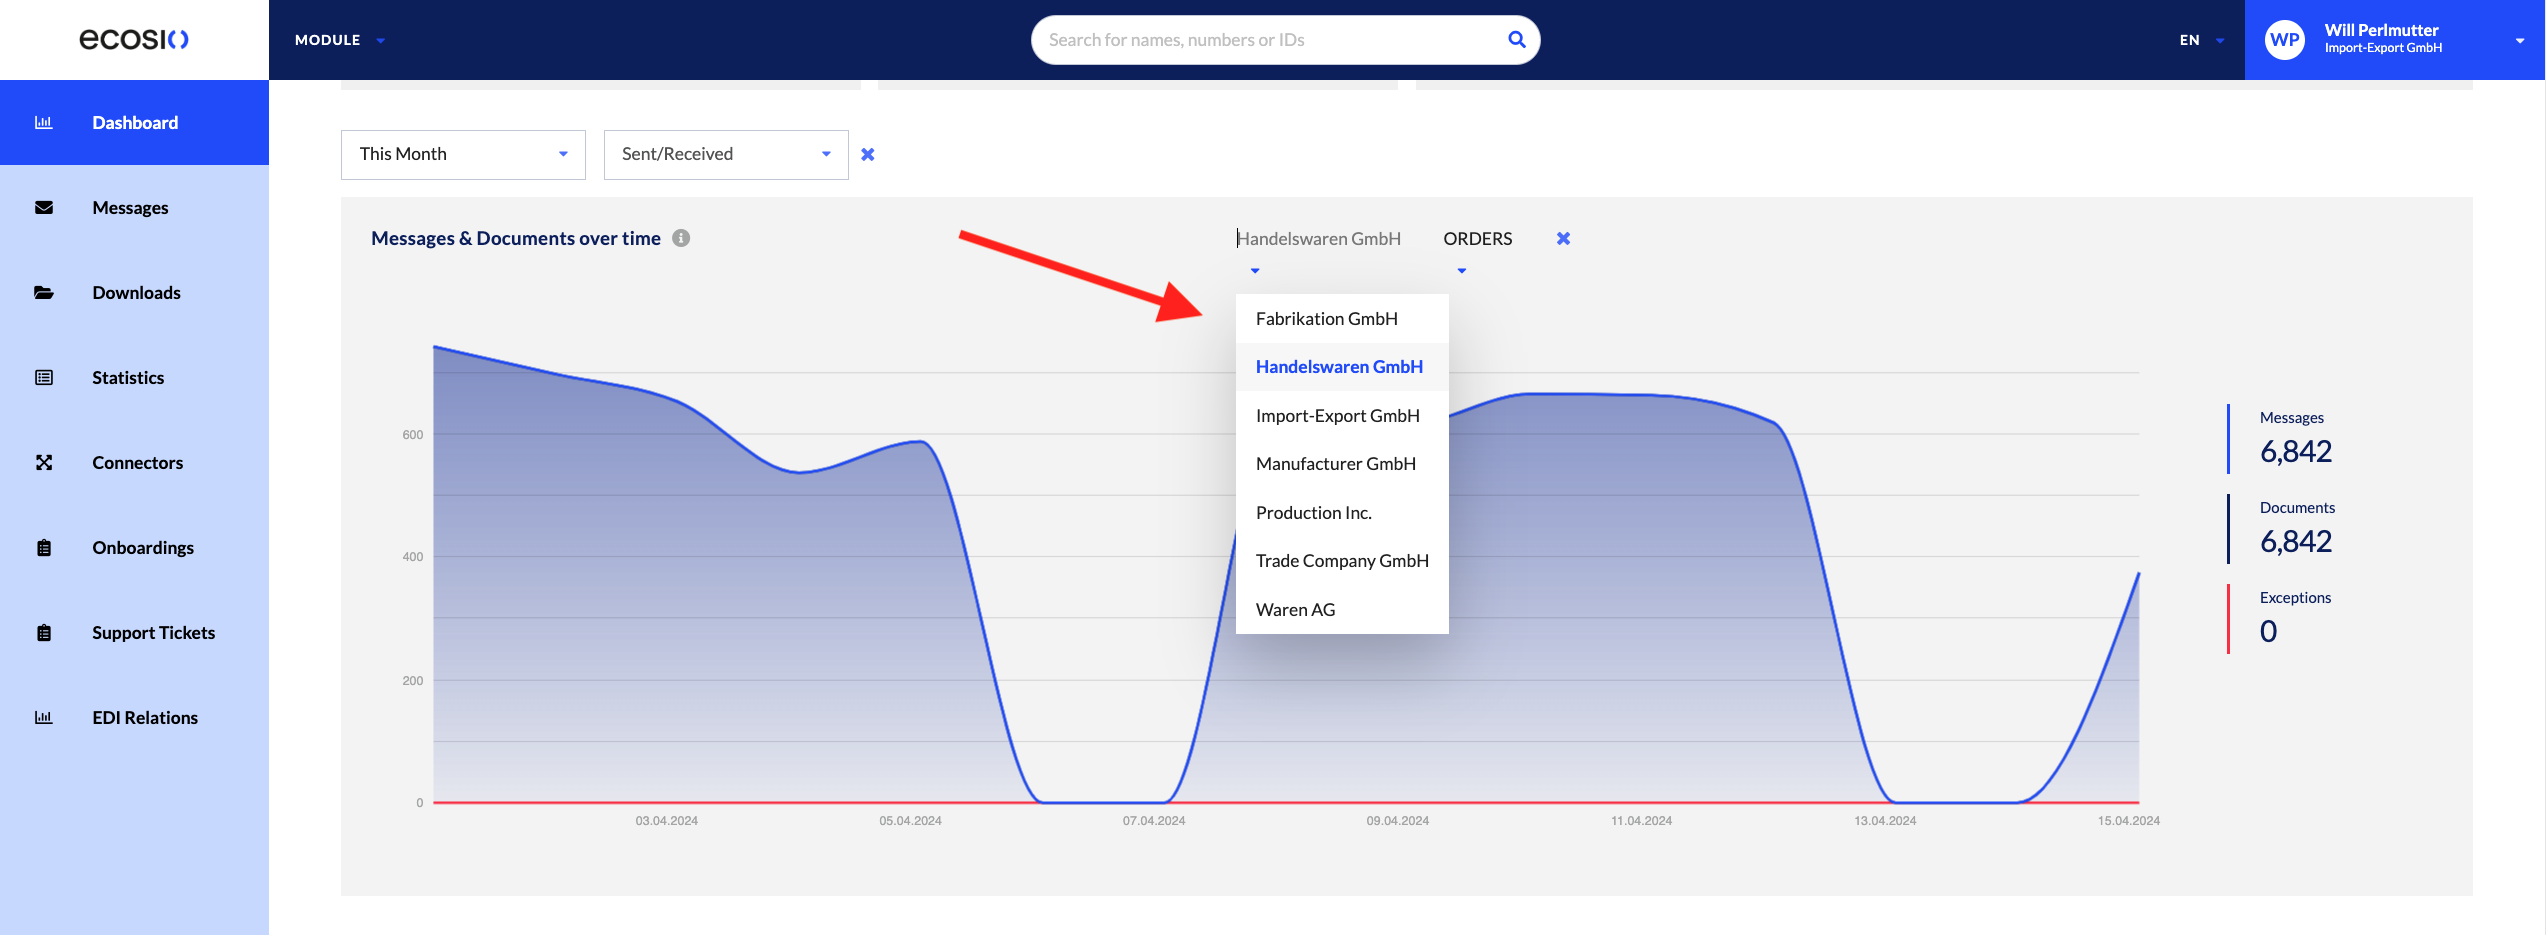
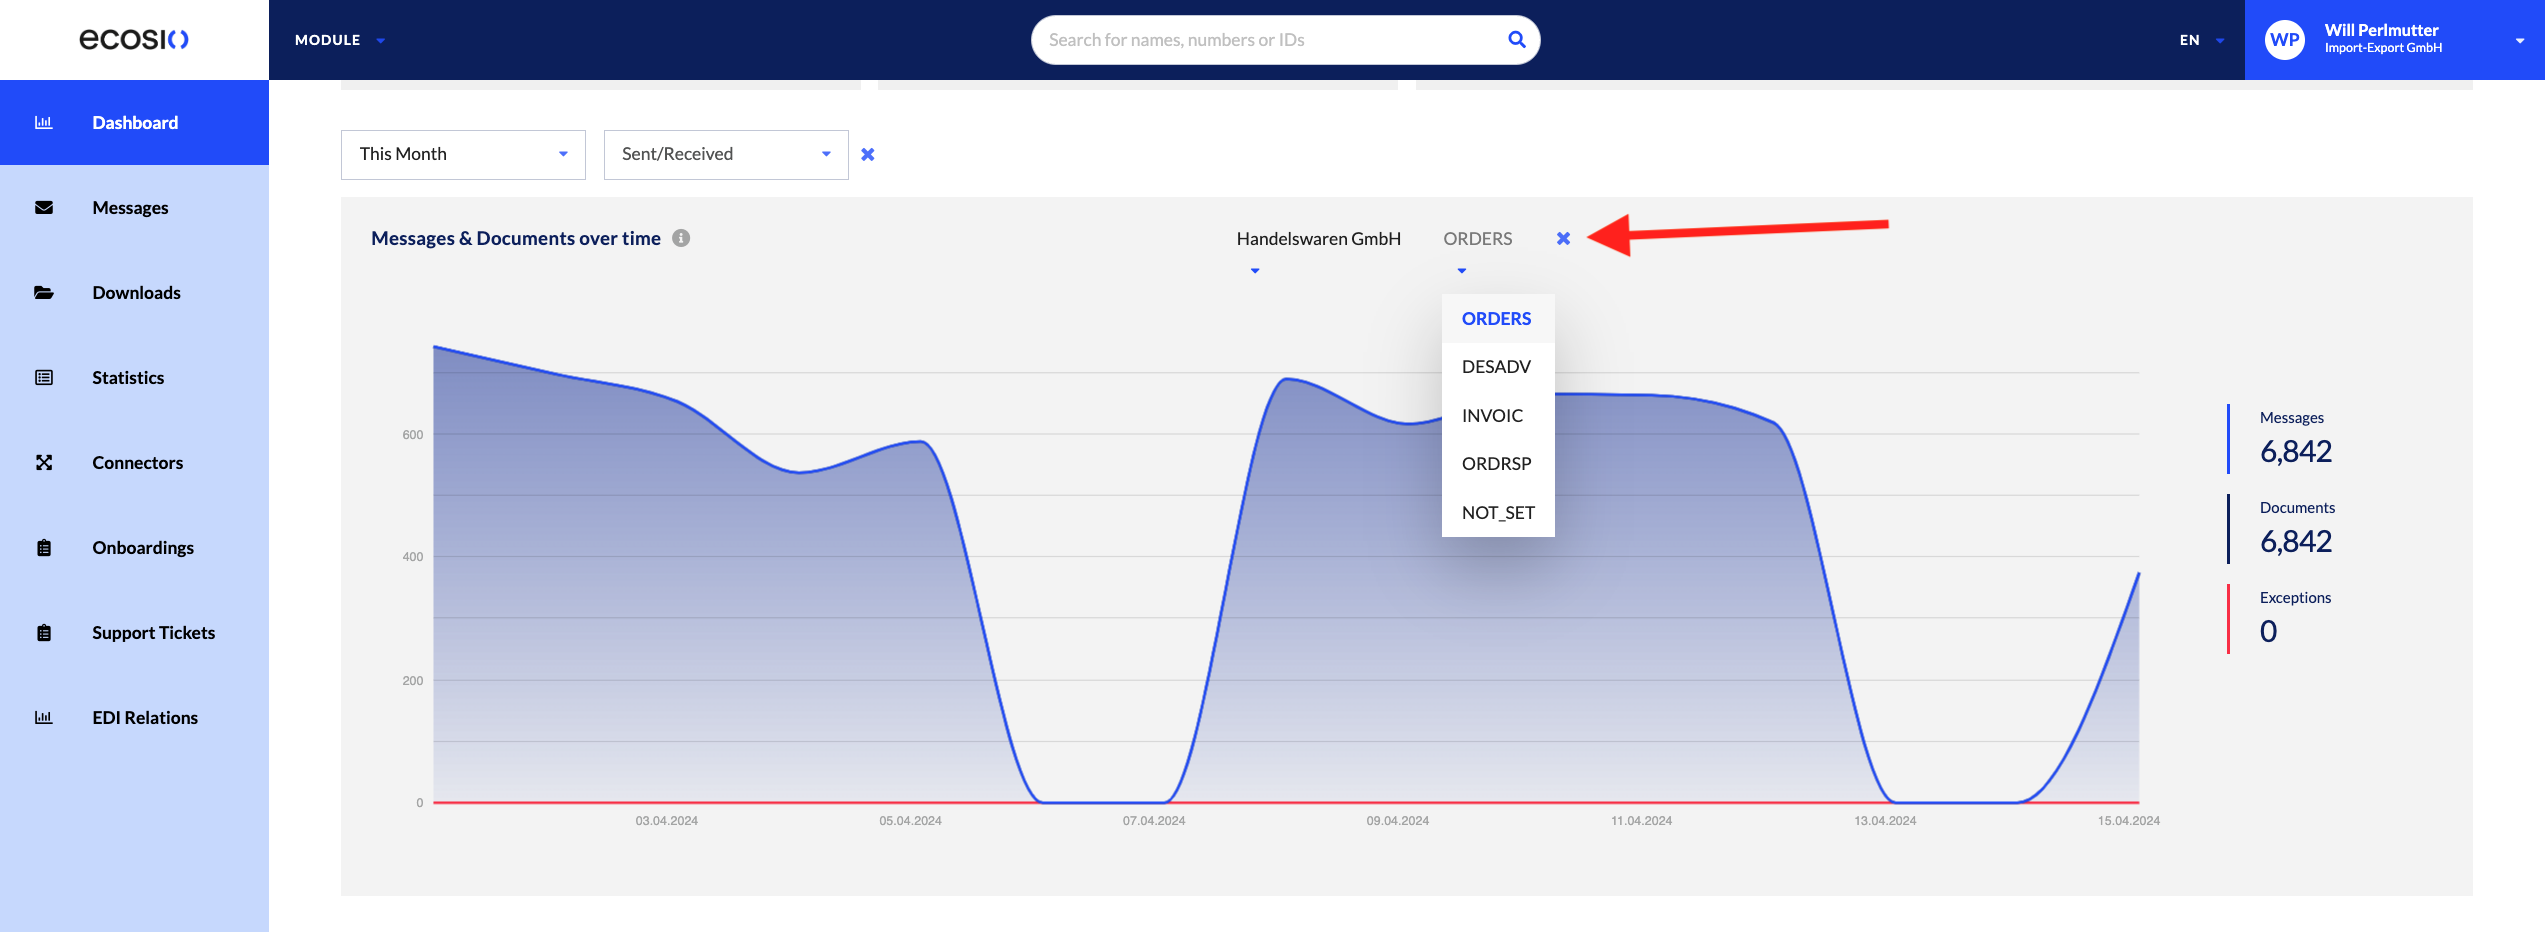
Below is an example of how messages, documents and exceptions are displayed during a time period, based on a specific EDI partner and message classification type:
Top EDI-Partners
Users can see who their top EDI partners are, based on messages and documents exchanged with them. A simple example of this is shown below:
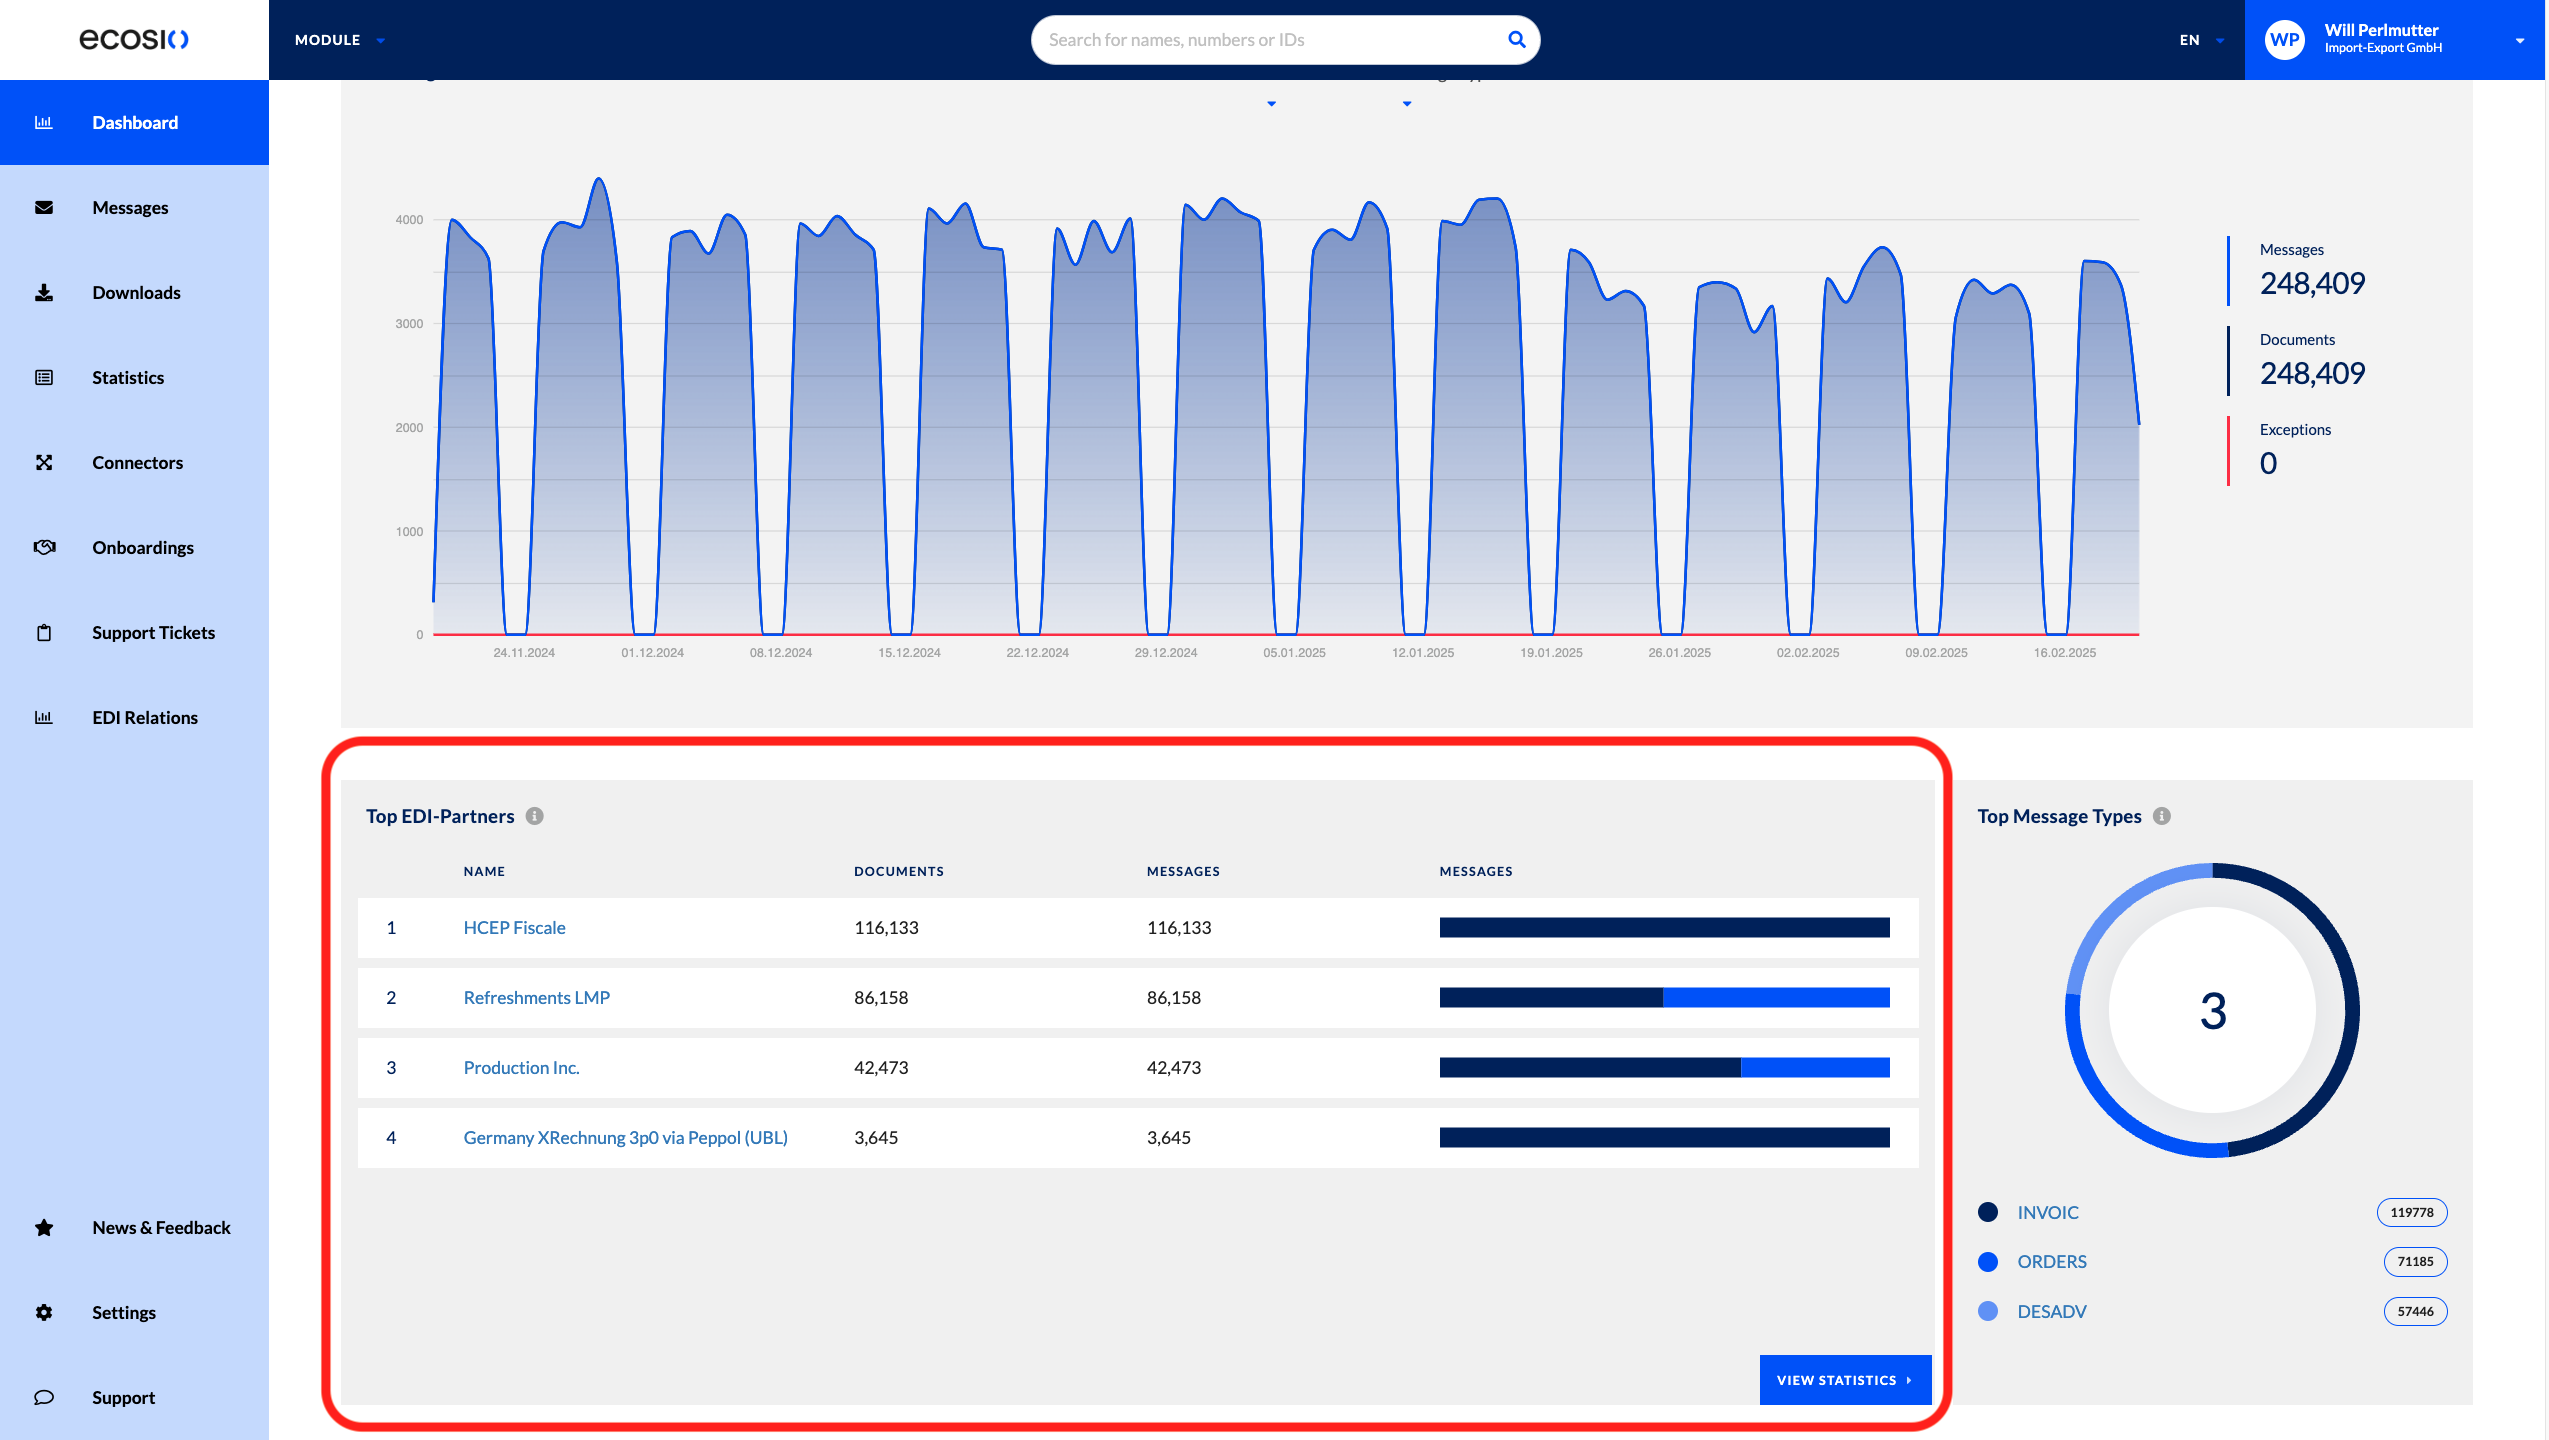
Additionally upon hover, users can view the distribution of message classification types, as shown below:
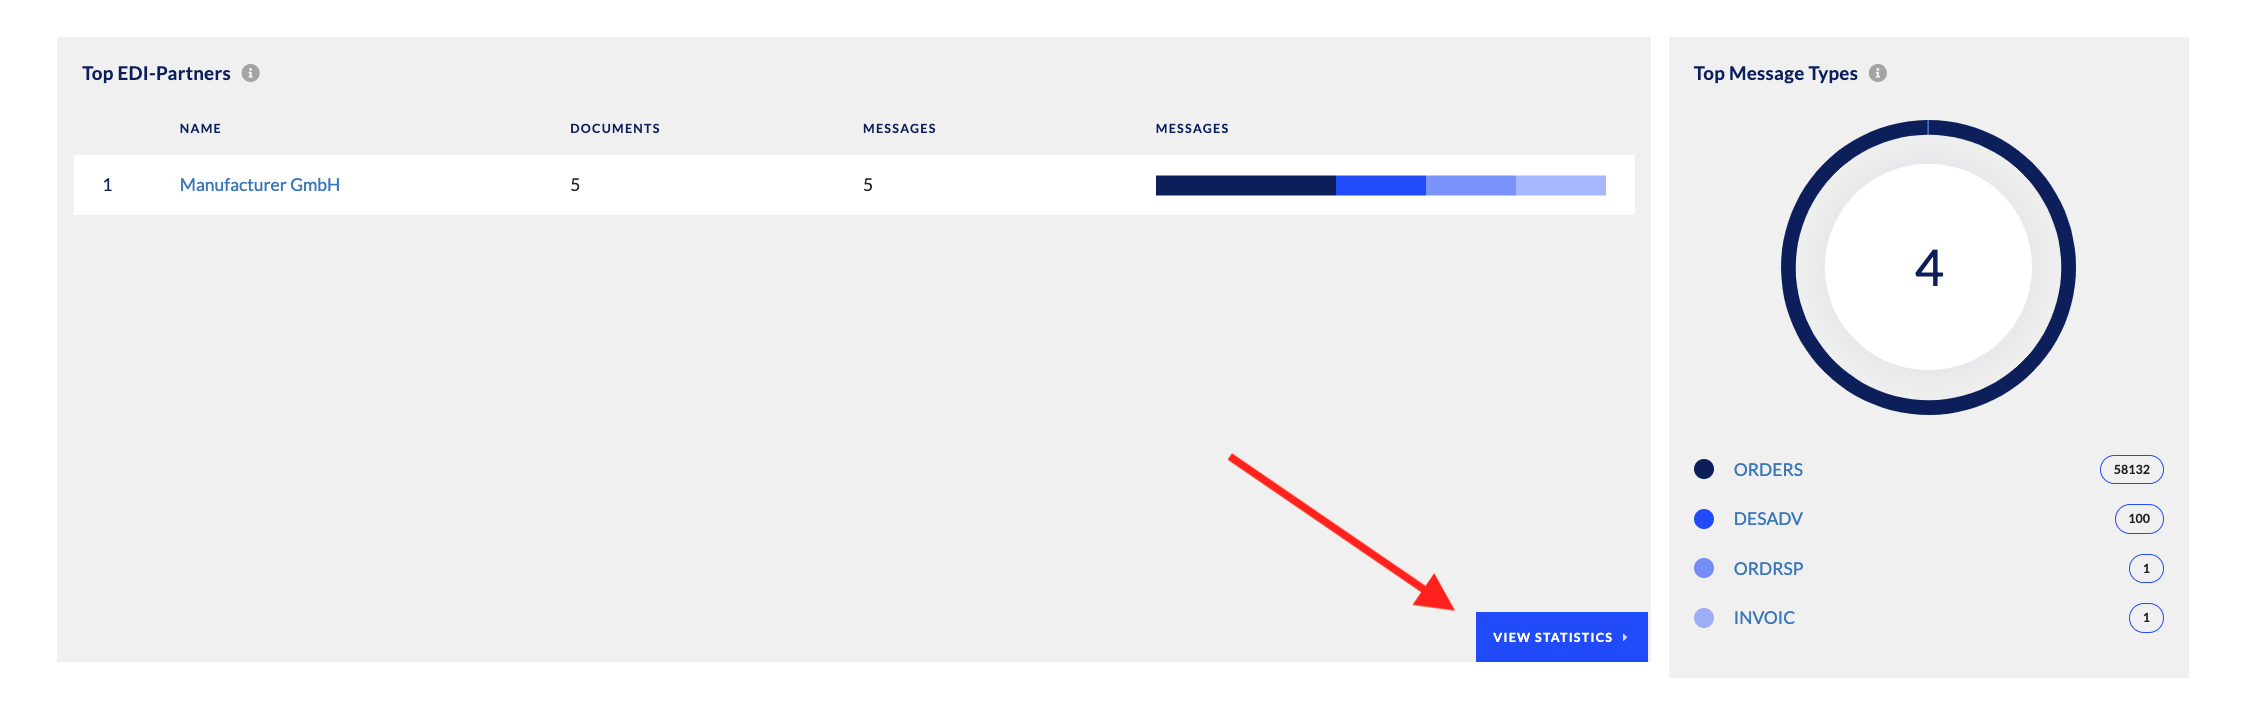
By clicking on the “View Statistics” button as shown below, users are taken to the Statistics Details page, where they can view the information for further drill-downs:
Top Message Type
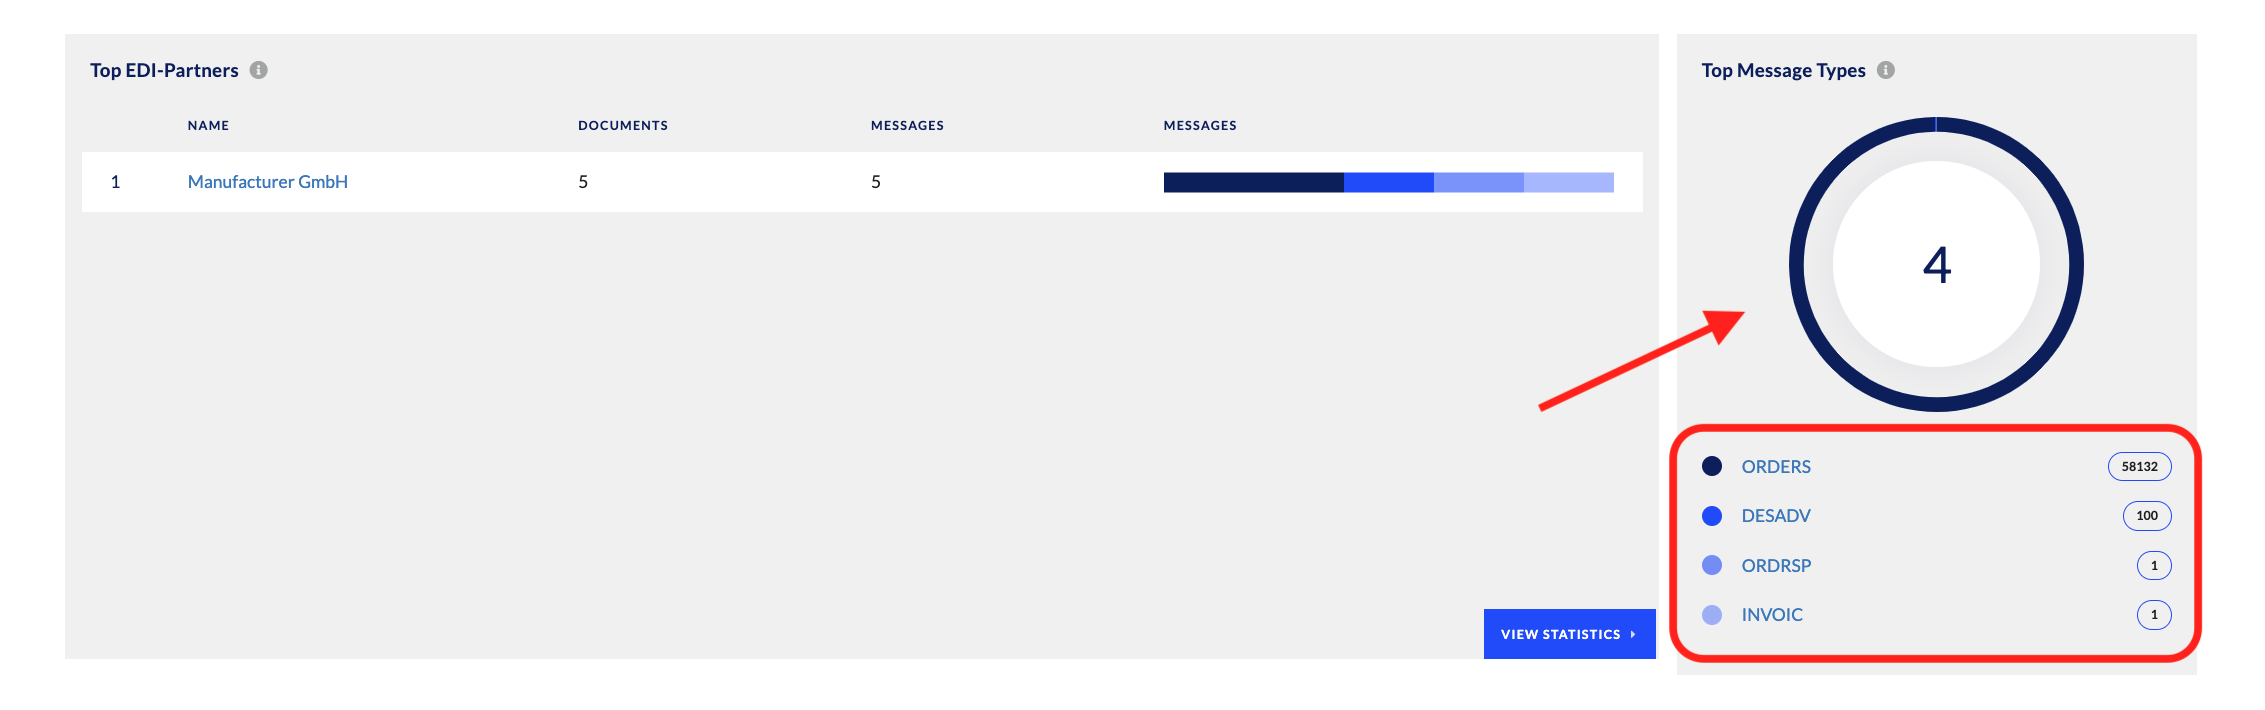
Users can also view top message types exchanged with EDI Partners. This information is not only displayed in pie chart form, but also the raw data is shown below:
FAQs
Why is the information displayed in the Statistics Details page different than the information displayed in the Dashboard?
- The messaging statistics rendered in the Dashboard derive from the Message Overview page and not the Statistics Details page. What is the difference? The Statistics Details page renders statistics based on messages billed (which have reached the ecosio integration hub and have been forwarded accordingly), whereas the Message Overview page renders all messages and documents, whether billed or not.
Why don’t I see messages displayed in the last 24 hours when clicking on this section of the dashboard?
- You do. Messages shown in the Message Overview page are, by default, displayed based on last message or document sent; therefore, even though the number shown in the Dashboard may not match the number shown in the Message Overview page, your latest messages and documents are displayed.
Updated 11 days ago